Open any "rate my portfolio" thread from a young investor and the same 3 tickers keep appearing, often side by side in the same account: SCHG, QQQM and SPMO. They get treated as interchangeable growth engines. On matched windows, 2 of them basically are. The third is running a different strategy entirely, and the gap is wide open right now.
What you actually own
SCHG is Schwab's U.S. Large-Cap Growth ETF (0.04% fee): the growth half of the large-cap universe, weighted by size. QQQM is Invesco's NASDAQ 100 fund (0.15%), the same index as QQQ in a cheaper wrapper aimed at buy-and-hold investors: the 100 largest non-financial Nasdaq names, which makes it tech-heavy by design. SPMO, Invesco's S&P 500 Momentum ETF (0.13%), is the odd one out: it holds roughly the 100 S&P names with the strongest recent 12-month price momentum and refreshes that list twice a year. The first 2 own growth as a category. The third owns whatever has recently been working, which is sometimes growth and sometimes not.
2 of these are the same trade
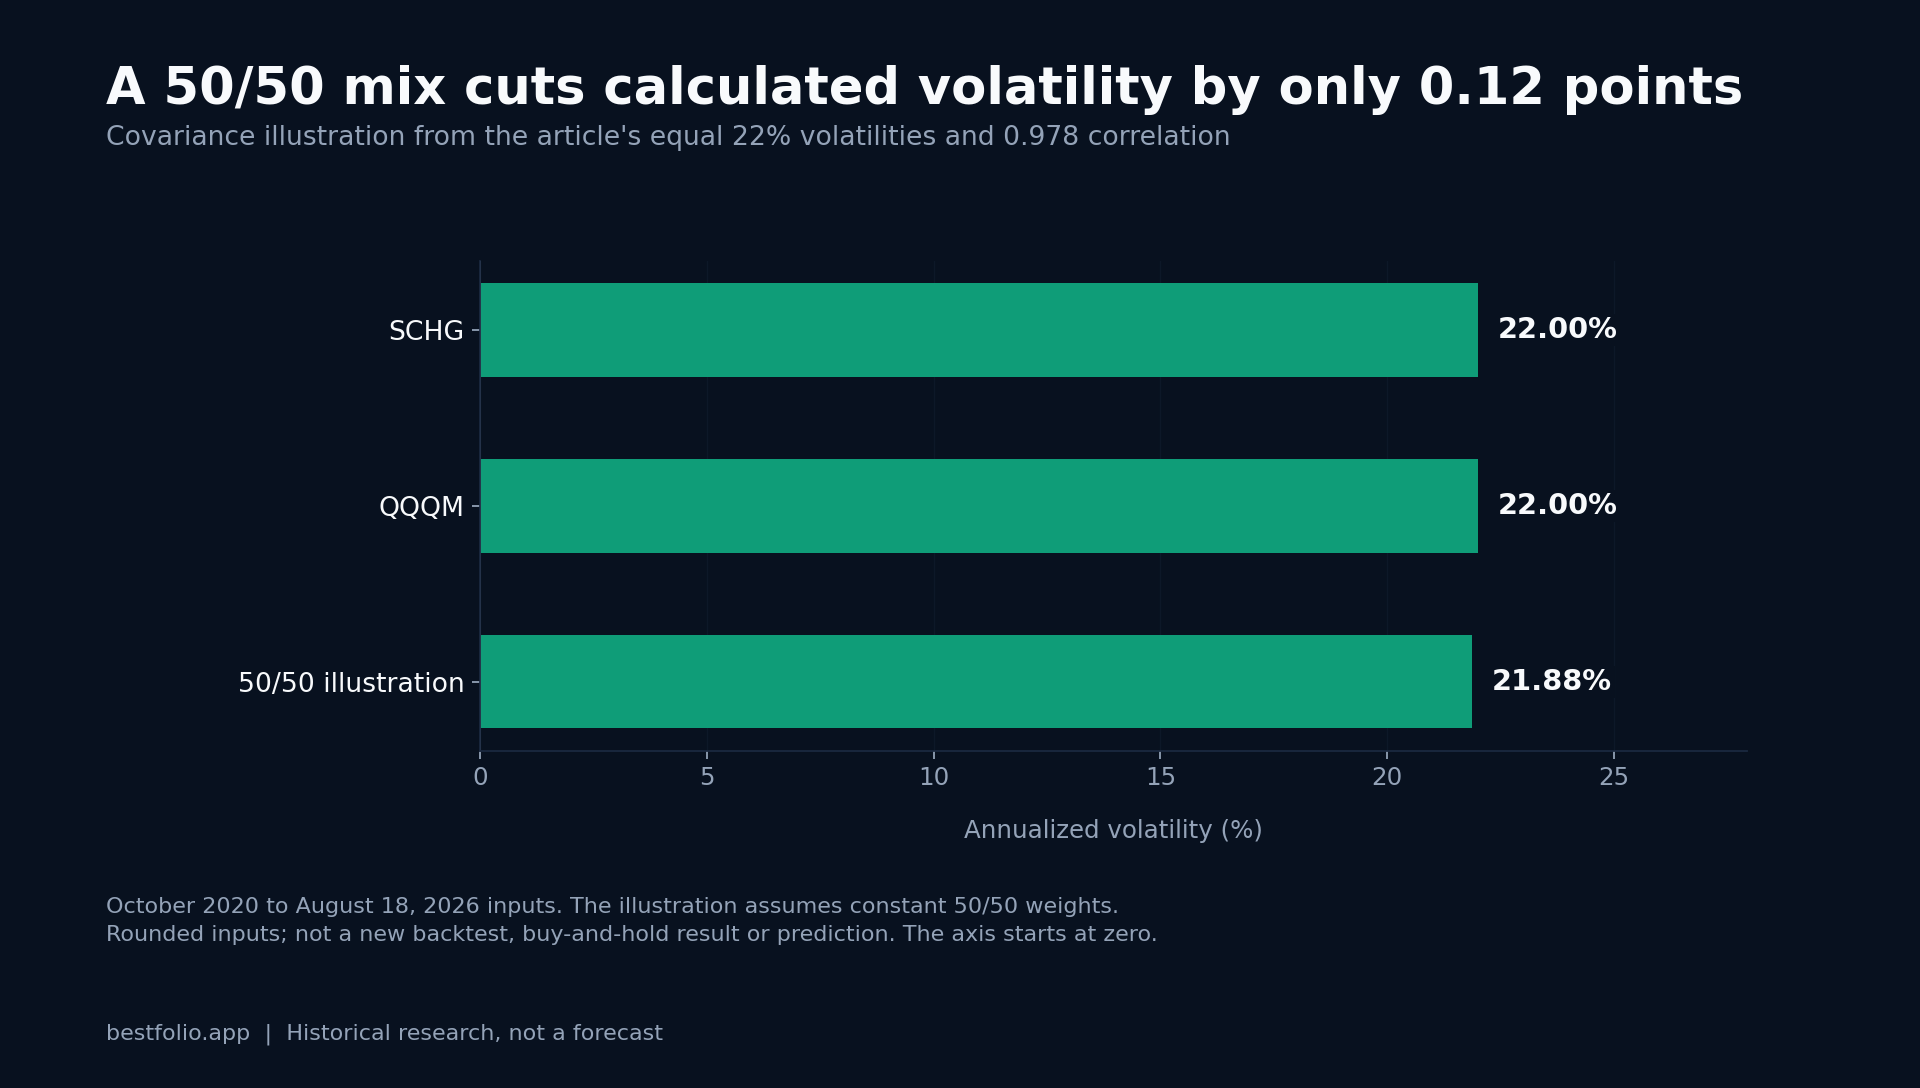
Since QQQM's launch in October 2020, the longest window where all 3 exist, SCHG and QQQM have a daily-return correlation of 0.978. Their annualized volatility is identical at 22%, their worst drawdown is identical at -35%, and their returns land within about 1 point of each other (15.9% vs 17.2% CAGR). Holding both is not diversification, it is 1 position bought twice with different logos. If overlap bothers you, pick 1 and keep the other slot for something that behaves differently.
The one that is actually different
SPMO's correlation to the other 2 sits near 0.82-0.85, and the matched-window numbers separate: 21.1% CAGR with a -23% worst drawdown, against 16-17% at -35% for the growth pair, over the same October 2020 to August 2026 window. The reason is visible in the calendar years. In 2022, momentum's semi-annual refresh rotated toward energy and defensives and SPMO lost 10% while SCHG and QQQ lost about a third. In 2024 through 2026 the refresh has been riding the winners, and SPMO is up 27% this year against SCHG's 8%.
Before that reads as a free lunch, look at 2023: SPMO made 18% while SCHG made 50% and QQQ 55%. A twice-yearly momentum refresh is structurally late to fast regime turns, and after the 2022 defensive rotation it re-entered the AI trade well behind the index. That is the recurring cost of the strategy: it tends to protect in long slides, and it tends to lag hard bounces. Over the full decade since SPMO's 2015 launch the totals are closer than the recent years suggest: 19.3% CAGR for SPMO vs 17.6% for SCHG and 20.1% for QQQ (using QQQ as the longer-lived stand-in for QQQM, same index).
The practical read
Treat SCHG vs QQQM as a coin flip on fee and index preference, never as a pair to hold together. Treat SPMO as the only genuine second position among the 3, priced with real tracking risk against the index in melt-up years. And matched windows matter more than any of these numbers: the trio has only coexisted for about 6 years, a period that contains exactly 1 bear market and 1 historic momentum run. Different 6 years, different table.
We track momentum-based rotation as a strategy class across much longer histories, including what the same matched-window discipline says about momentum ETFs vs tactical momentum strategies. Prices are adjusted daily closes through August 18, 2026; fees from the issuers' current factsheets.
Educational information only, not investment advice. Past performance does not guarantee future results.
| Series | Annualized volatility |
|---|---|
| SCHG (reported) | 22% |
| QQQM (reported) | 22% |
| 50/50 constant-weight illustration | 21.88% |