A strategy does not become more convincing because it was the best result in a large research process. The opposite is true. The more backtests we run, the more likely one of them will look exceptional by chance.
BestFolio's Robustness score uses the Deflated Sharpe Ratio from Bailey and Lopez de Prado. It estimates, on a scale from 0 to 1, whether a strategy's Sharpe ratio clears the result we would expect from the luckiest trial in the full tested set. Scores below 0.90 are flagged as fragile.
The hard part is not the final probability. It is deciding which trials belong in the denominator.
The public leaderboard is too small
Counting only published strategies would ignore the selection process that created the leaderboard. Every unreleased model was another chance to produce an attractive Sharpe ratio. If a researcher tests 20 specifications and publishes the best one, the evidence did not come from 1 trial. It came from a contest among 20.
BestFolio therefore includes active tested variants that remain in the research catalog, whether or not they are visible on the public leaderboard. A failed or mediocre model still raises the bar for the winner. Hiding it from users does not remove its role in selection.
This creates an uncomfortable property: adding a new strategy can reduce the robustness score of existing strategies. Their return series did not change. The evidence standard did.
Why the bar rises
Imagine drawing many return series with no real edge. Most will look ordinary. A few will look strong because randomness gave them a favorable sequence. As the number of draws rises, the expected best Sharpe rises too.
A raw Sharpe ratio asks how much return appeared per unit of volatility. It does not ask how many alternatives were tried before that result was selected. The Deflated Sharpe Ratio compares the observed Sharpe with a luck benchmark derived from the tested set, then accounts for the track-record length and the non-normal shape of the returns.
Longer histories help because chance has less room to dominate the full record. Skew and fat tails matter because a smooth-looking average can hide a small number of extreme observations. The tested-set denominator matters because selection can turn noise into a winner.
What still goes missing
Even the expanded denominator is a lower bound. Not every parameter adjustment tried during development is saved as a separate active variant. A researcher may test several lookbacks, thresholds, asset substitutions, and rebalance conventions before a strategy receives a formal row.
The wider literature creates another unlogged selection layer. A published paper may be the survivor of many rejected ideas. BestFolio can count the variants it tested. It cannot count every model that other researchers considered and abandoned.
This is why a high Robustness score is necessary evidence, not sufficient proof. The denominator is more honest than the public catalog, but it is not the complete history of human experimentation.
A fragile flag is not a rejection
BestFolio marks scores below 0.90 as fragile. The flag means the observed record has not separated itself strongly enough from the luckiest result expected across the tested set. It does not prove the strategy has no edge.
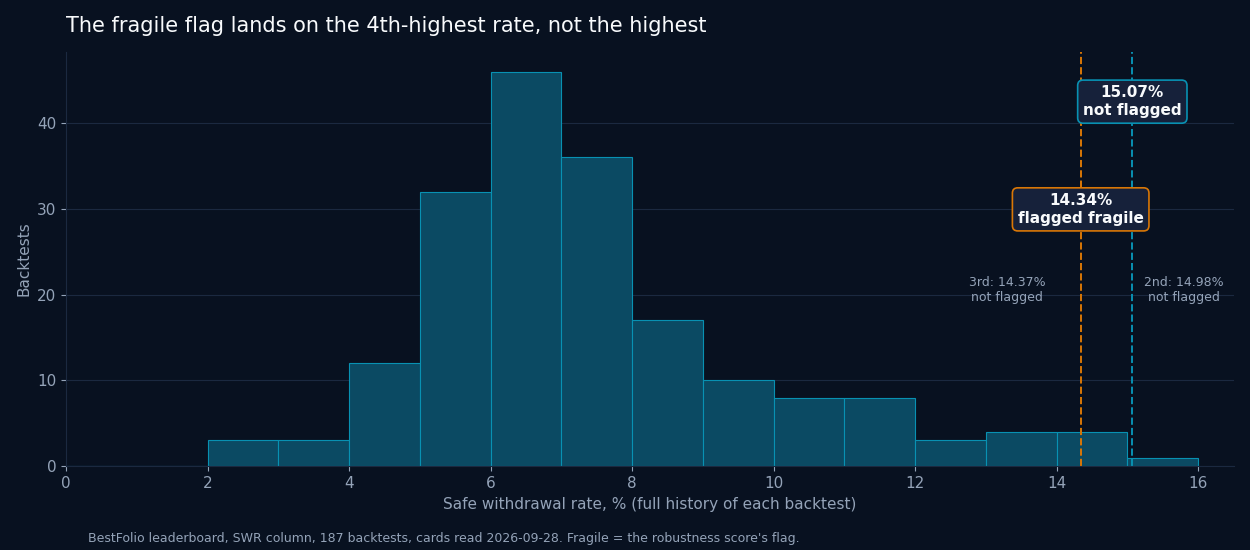
The most visible example in our own catalog is the 4th-highest safe withdrawal rate in the SWR table, 14.34%, which belongs to a strategy flagged fragile. The spectacular number and the weak evidence are the same story told twice.
| Rank | Safe withdrawal rate | Years of history | Robustness flag |
|---|---|---|---|
| 1st | 15.07% | 18.5 | Not flagged |
| 2nd | 14.98% | 44.6 | Not flagged |
| 3rd | 14.37% | 48.1 | Not flagged |
| 4th | 14.34% | 7.0 | Flagged fragile |
A short live history can produce a fragile score for a sensible rule. A century of proxy data can produce a high score for a model that is difficult to trade. Robustness addresses selection bias in the return record. It does not validate costs, capacity, taxes, signal timing, or implementation.
How to use the score
I use Robustness as a brake on the headline. If 2 strategies have similar return and drawdown, the one with the stronger evidence against selection luck deserves more attention. If a spectacular strategy is flagged fragile, the correct response is to inspect its history length, parameter sensitivity, and worst periods before sizing it.
The score also disciplines the research process. A new test cannot only help the catalog by finding a winner. It can hurt every existing score by raising the expected result from chance. That is a useful asymmetry. Research should create a higher burden of proof, not a larger menu of attractive charts.
The denominator should include the models we wish had never been tried. Those are the trials that tell us how easy it was to get lucky.
Read the Robustness methodology and compare the live scores.
Past performance does not guarantee future results. Backtested results are hypothetical and do not represent actual trading.