Flexible Asset Allocation (FAA) is the fifth strategy in the October batch, and it comes straight from an academic paper: Wouter Keller and Hugo van Putten posted it on SSRN in December 2012. Before listing it we rebuilt it from the paper and checked the rebuild against the paper's own published results. This is what that check found, and what the card shows now that it is live.
What the rule does
At each month-end FAA scores 7 funds: US stocks (VTI), developed and emerging market stocks (VEA and VWO), US bonds (BND), REITs (VNQ), commodities (GSG) and short-term Treasuries (SHY). Each fund is ranked 3 ways over the last 4 months: on return (higher is better), on volatility (lower is better) and on its average correlation with the other 6 (lower is better). The ranks are combined with weights of 1, 0.5 and 0.5, the 3 best combined scores are held at a third each, and any of those 3 whose 4-month return is negative is swapped for SHY.
The correlation rank is the part that made the paper worth reading. A fund that moves with everything else is marked down even when its momentum is strong, so the book leans towards holdings that diversify each other. Chimeric Asset Allocation, earlier in this batch, applies the same instinct to a leveraged book.
What the paper reported
The paper tested 7 mutual funds (VTSMX, FDIVX, VEIEX, VBMFX, VGSIX, QRAAX and VFISX, the last of them doubling as cash) and named the ETFs above as their modern equivalents. With no trading costs, its default model returned 14.2% a year from January 1998 to December 2012, with 8.5% volatility and a worst fall of 7.4% measured at month-ends. The authors developed the model on 2005 to 2012 (14.7% a year) and held back 1998 to 2004 as a test (13.4% a year). An equal-weight hold of the same 7 funds made 6.8% a year over the full window.
What the replication established
| Source, 1998 to 2012 | Annual return (%) | Annualised volatility (%) | Worst month-end fall (%) | Return per unit of volatility (ratio) | Annual turnover (x) | Trading costs (bps a trade) | Funds held (count) | What it holds |
|---|---|---|---|---|---|---|---|---|
| The paper | 14.2% | 8.5% | -7.4% | 1.67 | 2.9x | none | 7 funds | mutual funds |
| Our rebuild, the paper's funds | 14.6% | 9.6% | -6.8% | 1.53 | 2.8x | none | 7 funds | the paper's mutual funds |
| The card, same window | 12.6% | 10.4% | -8.2% | 1.21 | 3.4x | 10 bps | 7 funds | ETFs, with proxies before each launch |
On the paper's own funds the rebuild lands 0.4 points above the paper for the full window, and 0.2 points above it (14.4%) if every trade waits 1 extra day. Turnover matches almost exactly, 2.8x against 2.9x a year, which is the best evidence that the rules were read correctly: a misread rule usually shows up as a different trading rhythm before it shows up as a different return. Volatility comes out about a point higher than the paper's 8.5%, and the 2 halves disagree more than the whole does: 16.0% against the paper's 13.4% for 1998 to 2004, and 13.4% against 14.7% for 2005 to 2012.
That's what we mean by replicated. The published rules are specific enough that an independent rebuild on the same funds lands close to the published result. It isn't a claim that the result repeats.
Why the card is lower
Over the same window the card returns 12.6% a year, 1.6 points below the paper. Starting from our rebuild, 3 differences explain the gap.
The card holds ETFs, extended backwards with proxies where an ETF didn't exist yet, rather than the paper's mutual funds, and 2 of those funds are hard to stand in for. FDIVX is an actively managed international fund that beat the index history replacing it by about 2.8 points a year over the window (7.0% against 4.2%), and by 50.6% against 29.9% in 1999 alone. QRAAX was a total-return commodity fund, while the card's commodity history before 2006 is a spot index, which leaves out both the interest earned on collateral and the gain or cost of rolling futures. On the card's data the paper's exact rules return 12.9% a year before costs, so the data alone costs about 1.8 points.
The card also estimates 2 of the 3 ranks differently. The paper measures volatility and correlation from daily returns over the 4 months; the card uses the 4 monthly returns in the same window, a much noisier estimate of a correlation. Over this window it happens to cost nothing: the card's version returns 13.0% before costs, about 0.2 points more than the paper's estimator on the same data. It is still a departure from the paper that the card's rules should name.
Finally, the card charges 10 bps a trade, more in turbulent months, where the paper assumed free switching. That is worth the last 0.4 points.
What the card says
| Series | CAGR (%) | Sharpe ratio | Sortino ratio | Max drawdown (%) | Annualised volatility (%) | Time to recover that drawdown (months) | Annual turnover (x) | Years measured (years) |
|---|---|---|---|---|---|---|---|---|
| FAA | 9.90% | 0.70 | 1.08 | -24.37% | 9.69% | 20 months | 3.85x | 41.8 years |
| 100% US Stock Market, on FAA's dates | 11.85% | 0.60 | 0.87 | -55.45% | 18.07% | 53 months | 0.00x | 41.8 years |
Sharpe is measured above cash, as on every card since 18 October, and Sortino too since 20 October. The US market's own card now starts in 1900, so its row here is cut to FAA's dates, January 1985 to October 2026, to compare like with like.
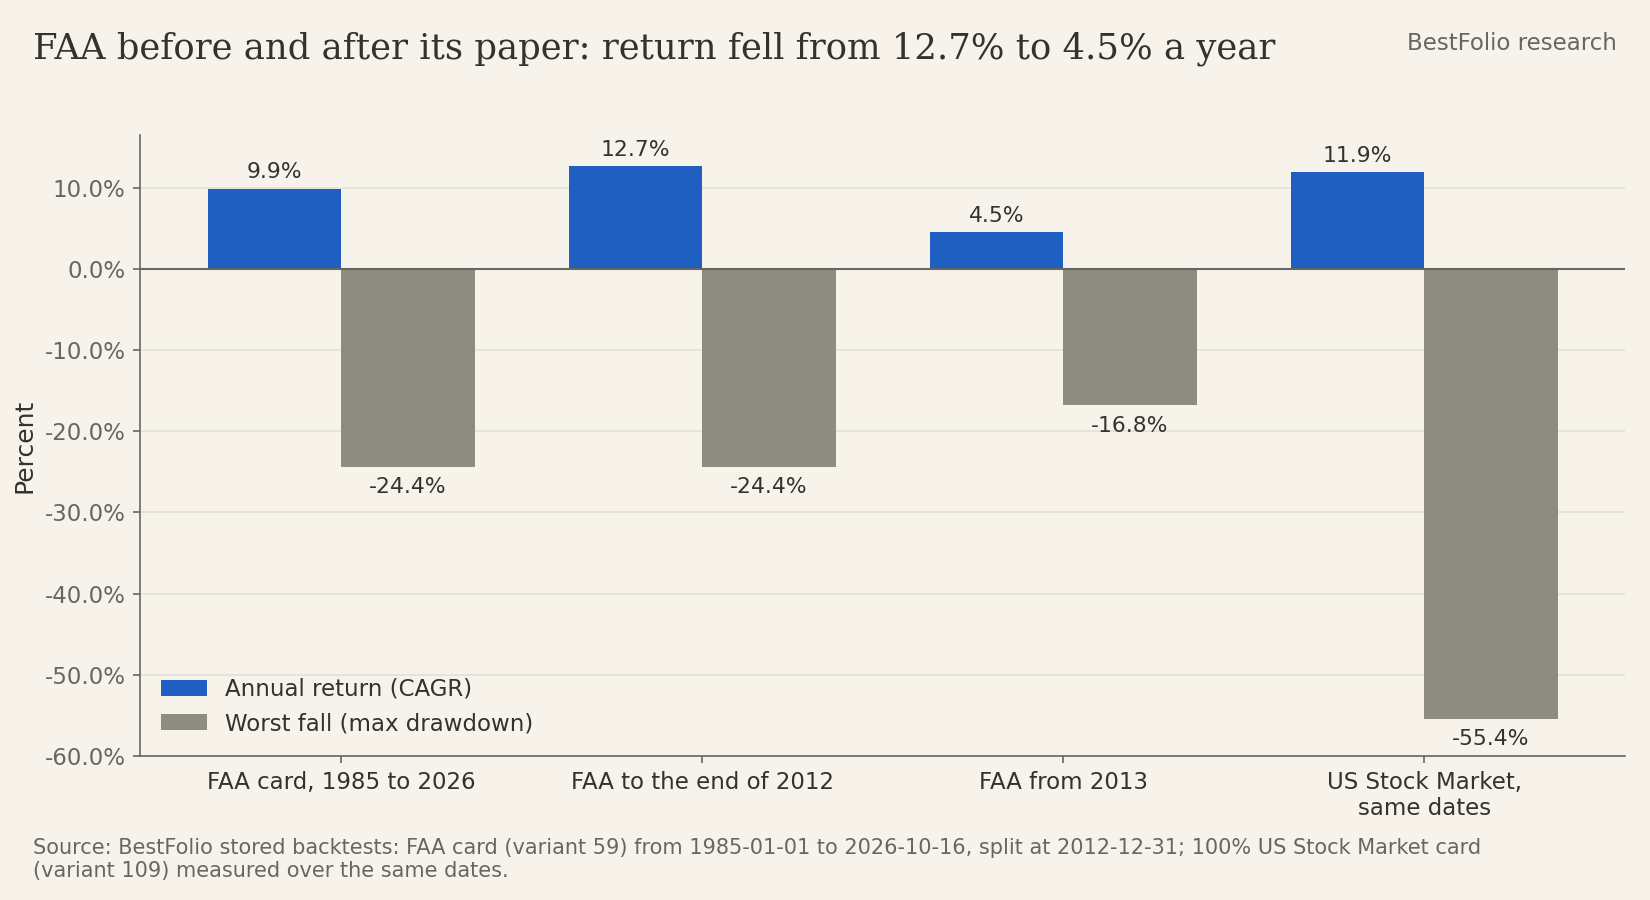
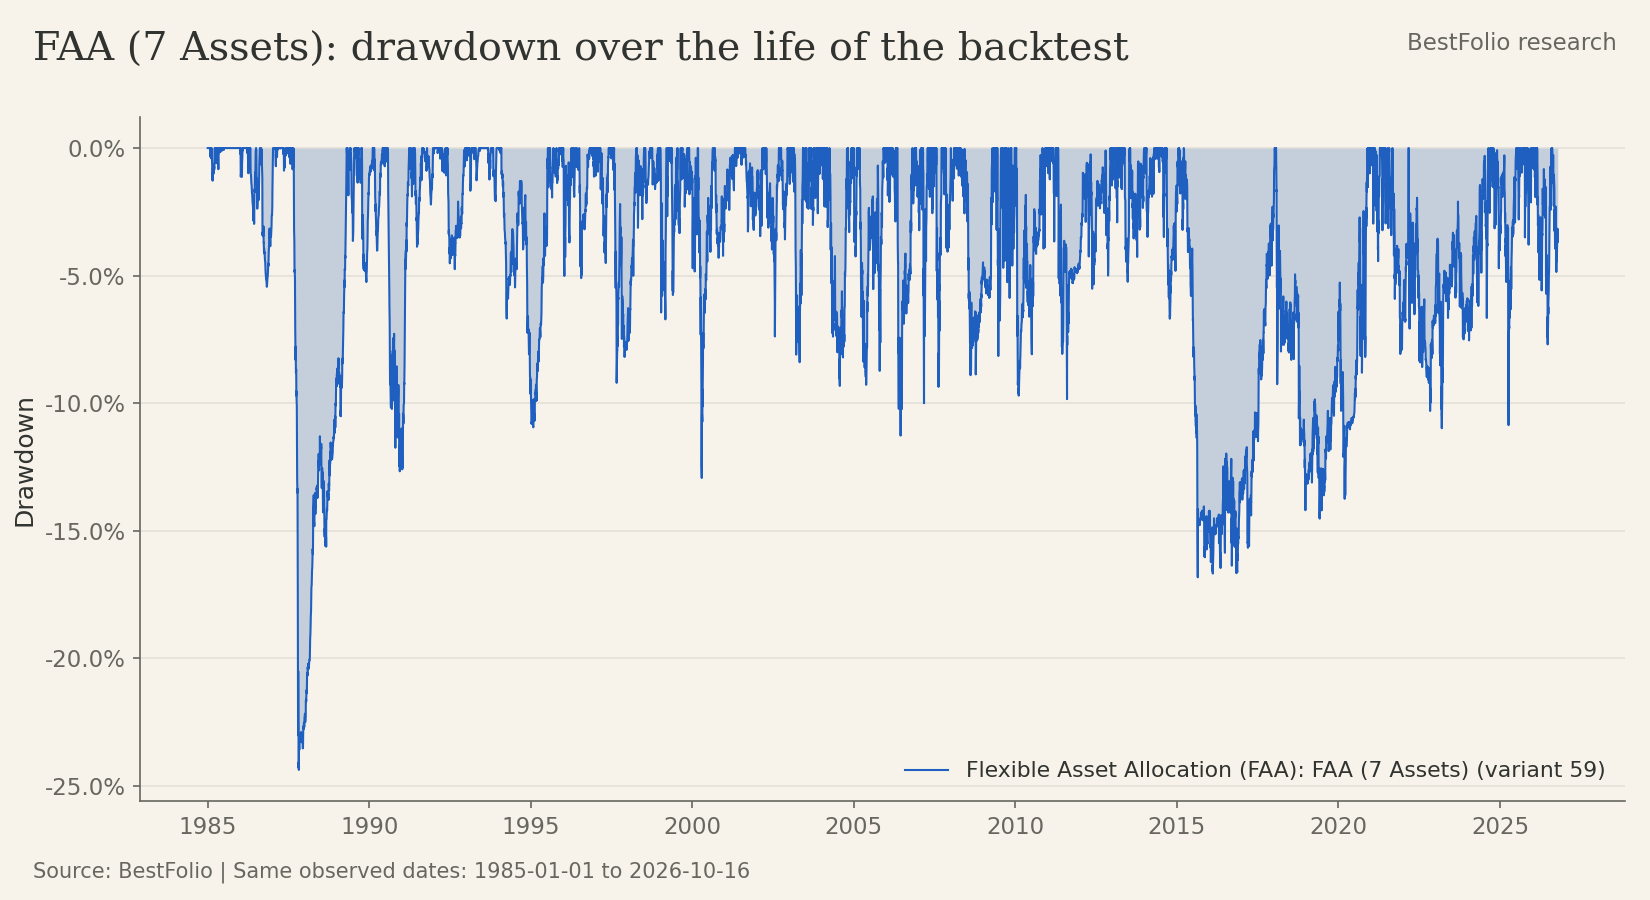
The worst fall on the card, 24.37%, is the October 1987 crash in reconstructed pre-ETF history. Since 1990 the worst fall is 16.82%, in 2015.
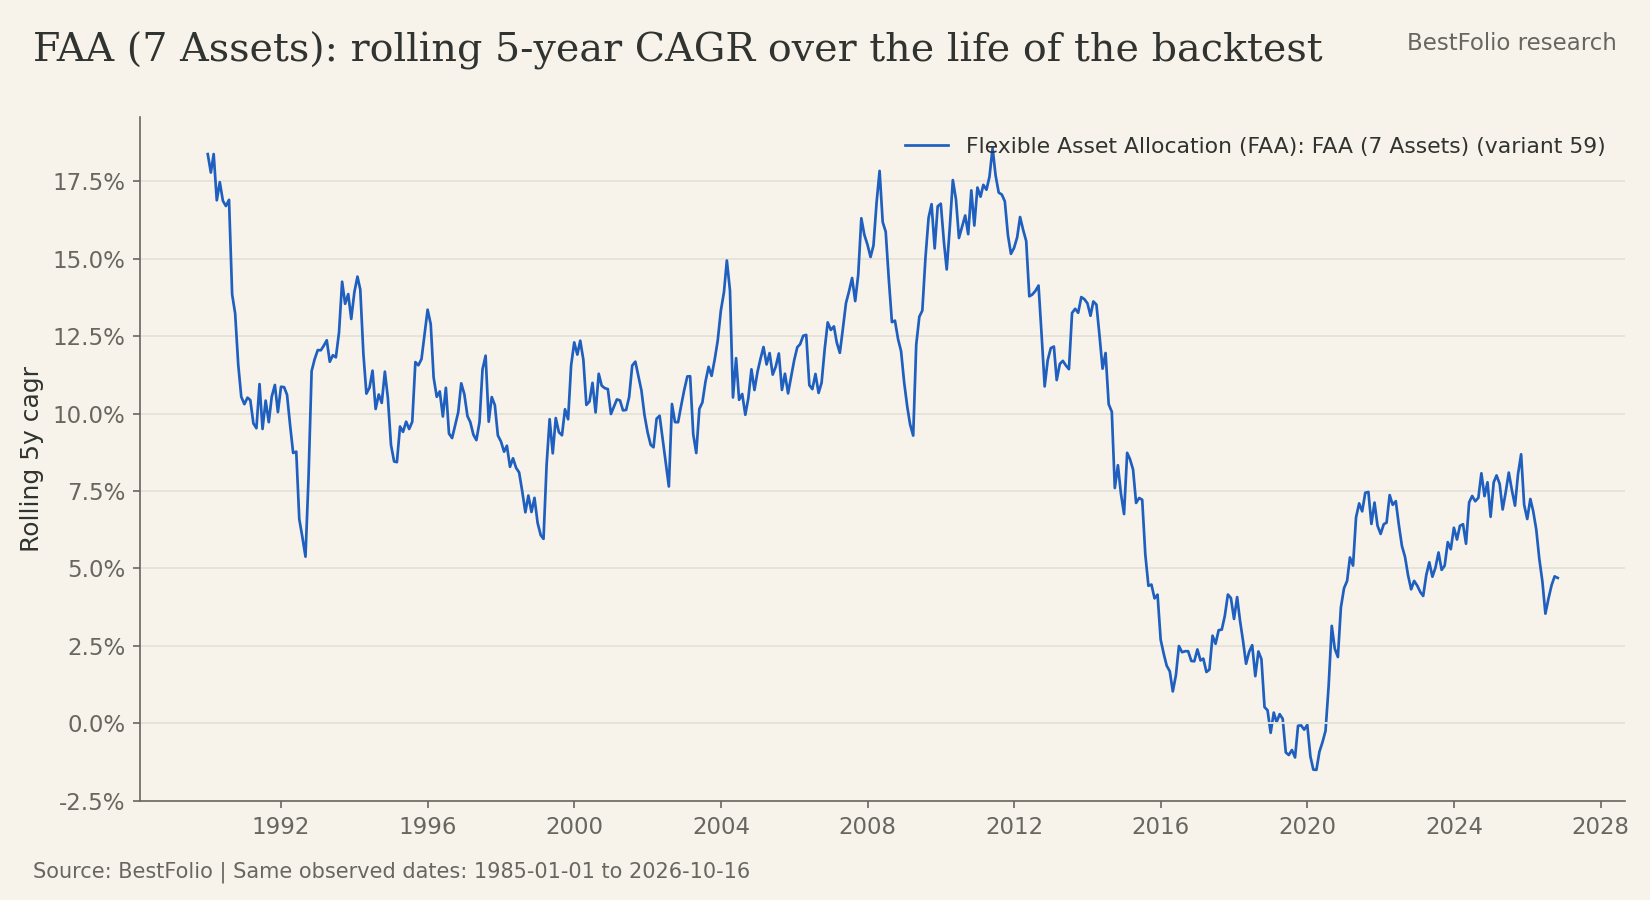
Here's the whole life of the rule in 2 charts, both from the card's stored backtest (1985-01-01 to 2026-10-16). The first is the CAGR over every rolling 5-year window, so each point from the end of 2017 onwards is made only of months after the paper. The second is the drawdown from the previous high, which is where I'd look to see whether the shallow falls held up after 2012.
Since the paper
I think this is the part of the record that matters most, and it isn't flattering. The card starts in January 1985, so 28 of its 41.8 years come before the paper was written. From 1985 to 2012 the backtest compounds at 12.69% a year with a Sharpe of 0.83. From January 2013, the first month after publication, it compounds at 4.46% a year with a Sharpe of 0.39, and 2015 (-10.82%) and 2018 (-7.53%) are its only losing years.
Over the same stretch the US market returned 14.44% a year and a 60/40 portfolio 9.71%, both from their own cards. The paper's own benchmark, an equal-weight hold of the same 7 funds rebalanced monthly, returned 5.9% a year on our data. FAA trailed all 3. It still did its job on the downside: its worst fall since 2013 was 16.82%, against 35.00% for the US market.
The paper itself hints at why the record might not travel. Its robustness chart shows 4 months as the best of the 8 lookbacks it tried over 1998 to 2012, by about 2 points a year over the next best, and the authors say they settled on 4 months after backtests over data running from 1986. A rule that sits on a sharp peak like that tends to drift towards its neighbours once it meets data it hasn't seen.
The useful conclusion
FAA replicates, and the rules in the paper are precise enough to rebuild: the rebuild lands within half a point of the paper's full-window result. What didn't survive publication is the return. Since 2013 the rule has behaved like a cautious balanced portfolio that trails a plain 60/40, with a shallow worst fall as its only consistent strength. Read the 9.90% on the card as mostly pre-publication history, and plan around something much closer to the 4.46% it has earned since the paper came out.