A reader asked us a fair question after our last 9Sig post: could we run it further back than 1999, add a 200-day moving average override that steps aside into cash, and report the 5th and 95th percentiles from a bootstrap using 24-month blocks?
We did. The answer is more interesting than the overlay working, which it does. The useful part is what the exercise says about reading any backtest of a 3x strategy.
How far back is honest
The Nasdaq-100 began on 1 October 1985. That's the floor. Simulators that offer dates back to 1953 aren't showing you the Nasdaq-100 before 1985, because there wasn't anything to show. The widely used reconstruction is admirably clear about this in its own documentation: its 1971 to 1985 stretch tracks the Nasdaq Composite, roughly 3,000 stocks rather than 100, and its 1953 to 1971 stretch is an undocumented construction with nothing real to check it against.
We start at 11 December 1986 instead, which is when a real total-return bond fund becomes available for the other half of the portfolio. The 14 months we give up contain no drawdown event. The October 1987 crash sits fully inside our window.
2 facts about that window are worth stating before any results. A 3x fund survives Black Monday: the Nasdaq-100's worst single day is -15.08%, which costs a 3x sleeve 45.2% and leaves it standing, since the wipeout line is a -33.33% index day. And financing is not a footnote. A 3x fund borrows 2 units of capital at whatever the overnight rate actually was, and that rate averaged 5.95% from 1985 to 1999 against roughly 1.5% since 2010. Our series prices it off daily effective Fed Funds back to 1954 rather than a flat modern assumption.
9Sig on its own, over 40 years
3 windows, same rules, same end date:
| Start date | Data | CAGR | Max drawdown | Final multiple |
|---|---|---|---|---|
| 11 February 2010 | Real TQQQ, no reconstruction | 39.86% | -72.13% | 262x |
| 1 July 1999 | Reconstructed before 2010 | 8.91% | -99.73% | 10.2x |
| 11 December 1986 | Reconstructed before 2010 | 18.06% | -99.73% | 737x |
The drawdown is identical in both deep windows while the headline return moves from 8.91% to 18.06% purely on where you start counting. That alone should make anyone suspicious of a quoted 9Sig CAGR.
It gets worse on inspection. The 1999 path spends 255.9 months underwater, and its longest single spell runs from 27 March 2000 to 23 July 2021. 21 years. Its final value is 1,057 times its own low point, which is another way of saying the compound return's a recovery from near-zero rather than a return on capital. Quoting a CAGR on a path like that is close to meaningless.
A better question than "what did it return?"
We resampled the monthly returns into 10,000 alternative histories using overlapping 24-month blocks, which keeps 2-year stretches of market behaviour intact rather than shuffling individual months apart. Then instead of asking what the median path returned, we asked how many paths ever fell below 1% of their own peak. Below that level an investor is finished in practice, whatever the arithmetic does afterwards.
Bare 9Sig reaches that state in 41.7% of resampled histories. 4 in 10. The 5th-percentile outcome is a CAGR of -19.03% and a terminal value that rounds to zero.
| 1999 window, 24-month blocks | Max drawdown p5 | p50 | p95 | CAGR p5 | Paths reaching ruin |
|---|---|---|---|---|---|
| 9Sig on its own | 74.63% | 98.64% | 99.99% | -19.03% | 41.72% |
| With the 200-day override | 49.71% | 63.35% | 80.61% | +7.66% | 0.00% |
Block length matters here, and not in the comfortable direction. At 12-month blocks the ruin share is 37.0%; at 24 months it is 41.7%. Longer blocks keep crisis sequences together, and the strategy looks worse when they stay together. The reader who asked for 24-month blocks was asking for the harder test.
What the overlay does
The rule: when the Nasdaq-100 closes below its 200-day simple moving average, the stock sleeve moves to cash. The bond sleeve is untouched and 9Sig's quarterly mechanics keep running. 4 choices matter and we state them rather than bury them. The average is computed on the unleveraged index, not the 3x series. Execution is delayed to the next close, so no trade uses a price it could not have seen. Cash earns the actual overnight rate of the era, which matters enormously, since cash paid 5.79% on average from 1986 to 2000. And we tested both keeping and pausing the 9% quarterly target while in cash.
From 1999 the overlay takes the strategy from 8.91% and -99.73% to 22.05% and -68.68%, cutting time underwater from 255.9 months to 117.1. In the bootstrap it removes the ruin mode entirely: 0.0% of paths fall below 1% of peak, against 41.7% without it, and the 5th-percentile CAGR moves from -19.03% to +7.66%.
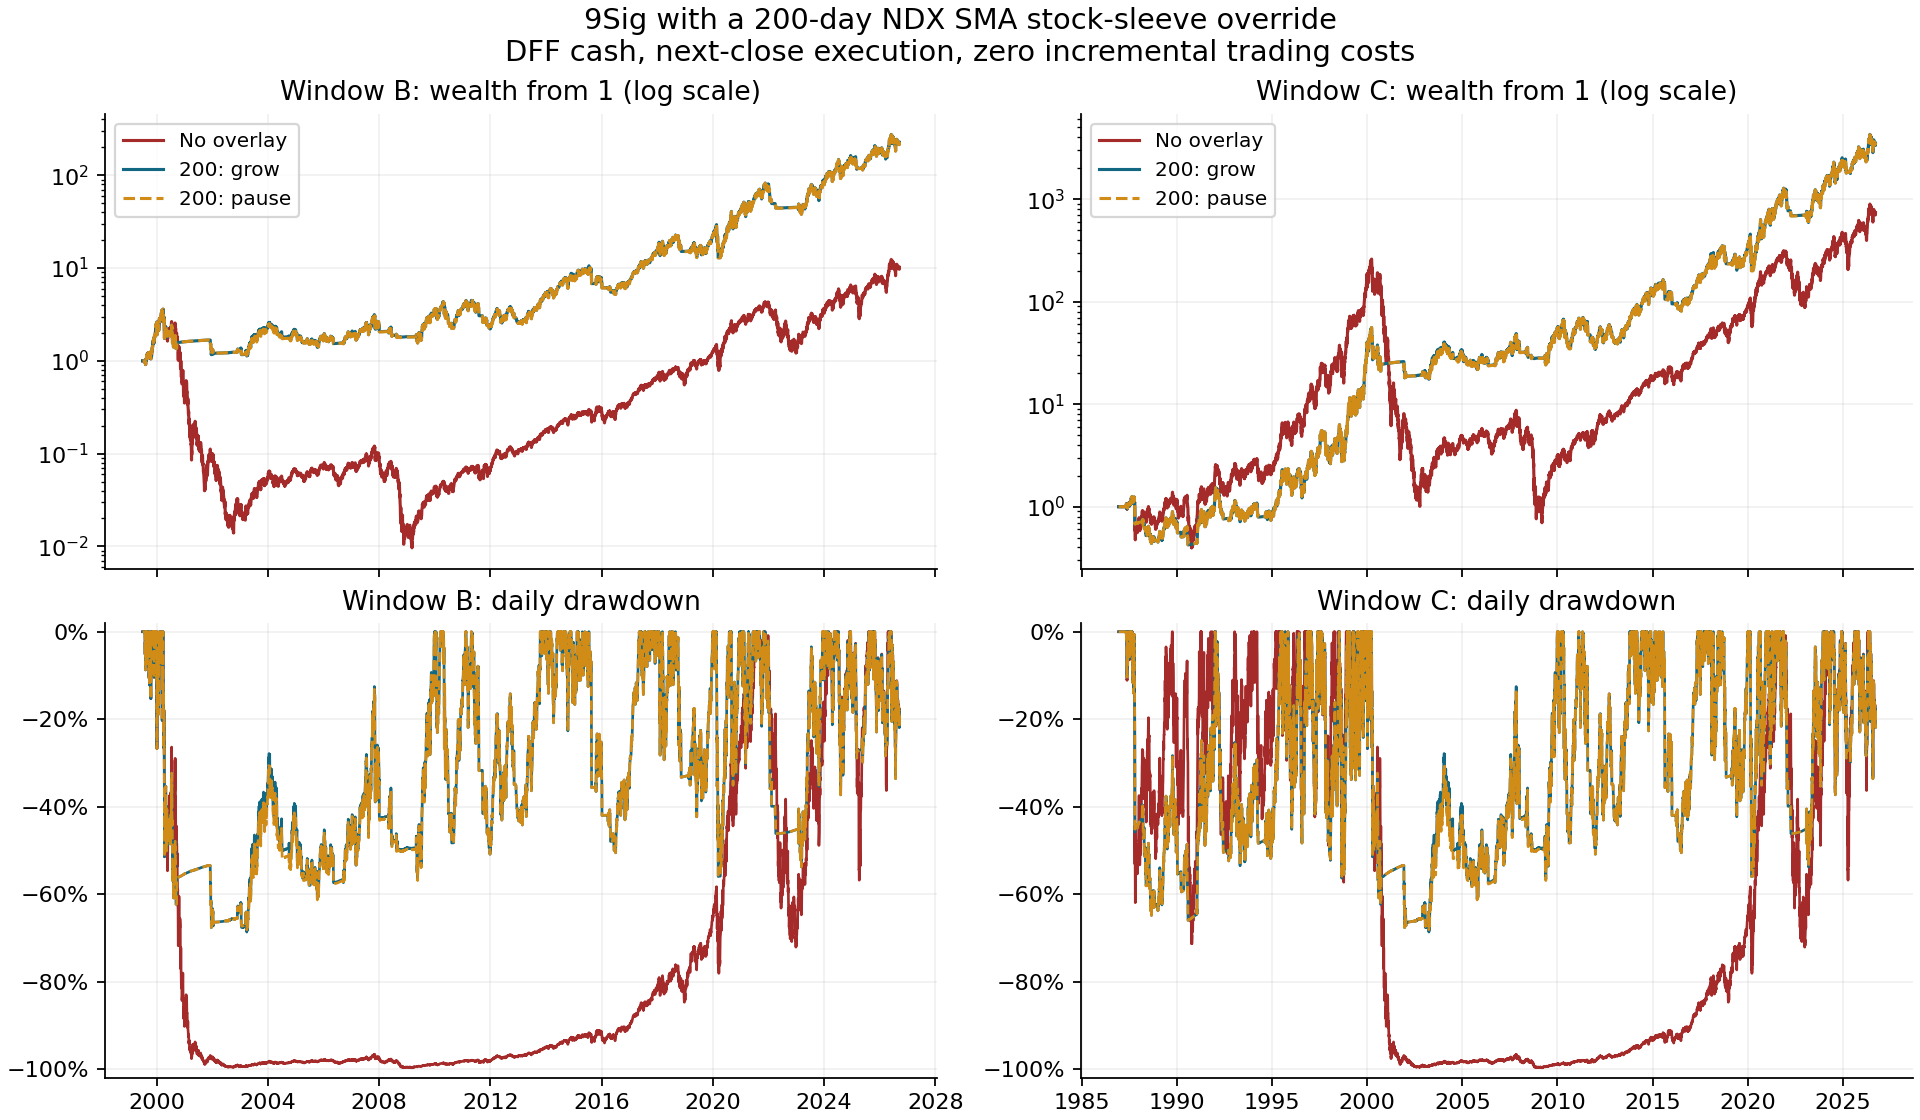
Keeping or pausing the quarterly target while in cash made almost no difference, 22.05% against 22.02%. We expected that choice to matter and it did not.
3 reasons not to get excited
It costs money when nothing crashes. Over the 2010 window, which contains no dot-com and no 2008, the override turns 39.86% into 31.53%. That is 8 points of annual return handed over to reduce the drawdown from -72% to -55%. The entire benefit above comes from 2 specific crashes. Anyone reading this as free insurance is reading it wrong.
The parameter surface is jagged. The 200-day setting ranks first on return in both windows and under both target rules, which sounds like robustness. It isn't. The 150-day setting loses more than 90% in both windows where the 200-day setting loses 69%, with the 100-day setting between them.
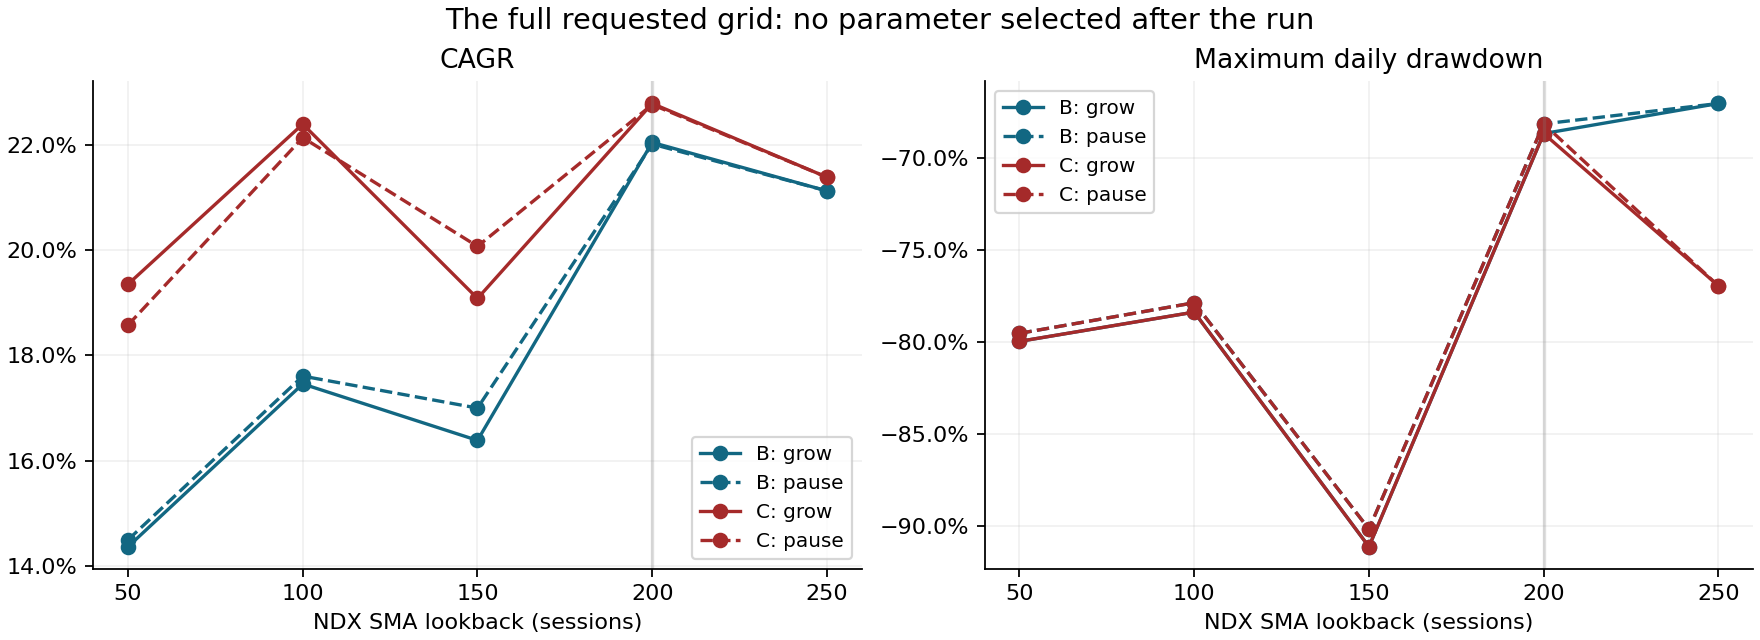
When neighbouring settings behave that differently, the result is telling you about this particular sample rather than about how markets work. We report 200 because it was specified in advance, not because it won.
The 2 windows aren't independent. The 1999 window sits entirely inside the 1986 window. Agreement between them is much weaker evidence than agreement between 2 separate histories would be.
What we're not claiming
The bootstrap reshuffles the strategy's own realised returns. It does not rebuild market history and rerun the strategy against it, so the override's advantage is partly built into the series being resampled. Every figure here is gross of trading costs and taxes, and the override trades 3.49 round trips a year and sits in cash for 1,791 sessions in the 1999 window. Before 1999 no Nasdaq-100 total-return series exists outside institutional data, so dividends are added back as an assumed yield rather than observed. And the bond fund's price is frozen for 4 consecutive sessions across Black Monday, so the path through that specific week isn't fully real even though the data is.
None of that overturns the finding. It does mean the honest summary is narrower than the headline: on one 40-year reconstructed history, a trend filter removed a ruin mode that a quarterly rebalancing rule could not survive on its own, at a cost of roughly 8 percentage points of annual return in the stretch with no crash in it, using a parameter whose neighbours behave badly.
We'd rather publish that sentence than the 22% CAGR.