VIX Adaptive Momentum uses the volatility index as an input to the allocation rather than as a thing to trade. Its card covers 34.6 years, the shortest of the October batch, because that is as far back as the VIX record usefully goes. Here is what it shows now that it is live.
What the rule does
Each month the strategy ranks 4 funds (SPY, VXF, EFA and AGG) on momentum and holds the leader, or the top 2, in equal weight. What the VIX changes is how far back that momentum looks: 10 months when the 40-day VIX average is at or below 18, 3 months when it is elevated, 1 month in a crisis. Any pick whose momentum is negative sits in cash (BIL) instead. Top 1 and Top 2 are the 2 published settings of how many funds it holds.
Using VIX as a regime input rather than a signal to trade is the distinction worth holding onto. Nothing here is long or short volatility. The index is doing one job, which is setting how fast the momentum reading reacts.
What the card says
| Metric | Top 1 | Top 2 | 100% US Stock Market |
|---|---|---|---|
| CAGR | 12.81% | 11.09% | 11.45% |
| Sharpe | 1.00 | 0.97 | 0.80 |
| Sortino | 1.78 | 1.73 | 1.24 |
| Max drawdown | -32.74% | -29.68% | -55.45% |
| Annualised volatility | 14.80% | 12.95% | 17.81% |
| Months to recover that drawdown | 45 | 46 | 53 |
| Annual turnover | 4.24x | 3.06x | 0.01x |
| History on the card | 34.6 years | 34.6 years | 38.7 years |
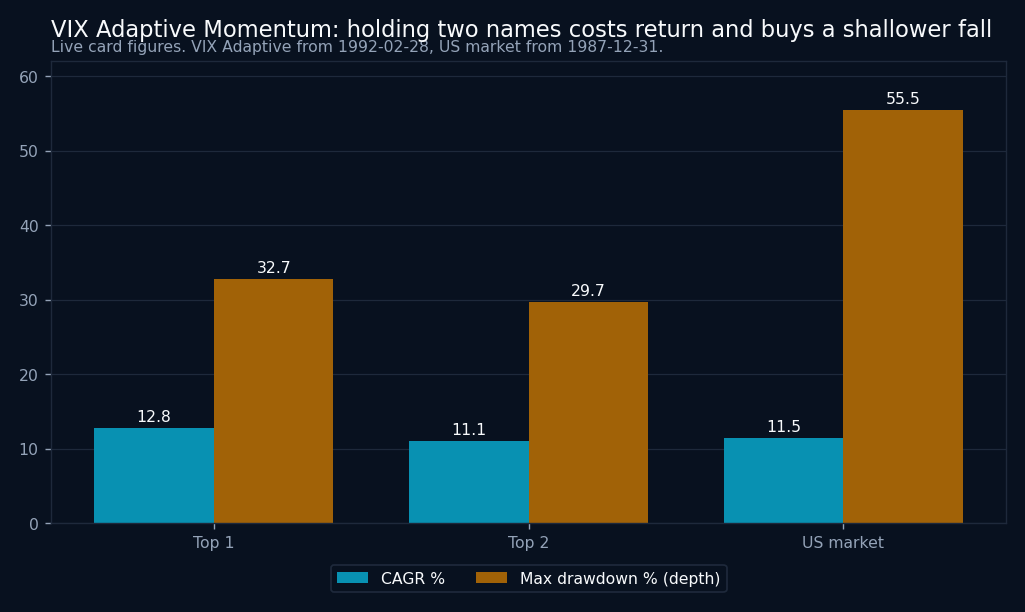
Top 1 against Top 2 is the whole decision
The 2 variants are within 0.03 of each other on Sharpe, 1.00 against 0.97. Everything else is a trade you get to pick. Top 1 returns 1.72 points more a year and falls 3.1 points further. Top 1 is also slightly better on Sortino, 1.78 against 1.73, and its recovery took one month less.
Turnover is where they genuinely separate: 4.24x a year against 3.06x. Top 1 is the highest-turnover row in the October batch by a wide margin, and that is the number to weigh before the CAGR, because it is the one you pay with certainty.
The short card is a real limitation
34.6 years is the shortest history of the 4 October additions, and it is short for a reason we cannot engineer around: the strategy needs a volatility index, so the record cannot credibly start before one existed. That means this card contains fewer independent regimes than the 52.6 year and 54.5 year rows beside it.
It does include 2000, 2008 and 2020, which is the part that matters for a rule whose whole premise is behaving differently when volatility spikes. But a shorter record is weaker evidence, and a Sharpe near 1.0 over 34.6 years should not be read as equivalent to a 1.13 over 52.6.
The card is candid about the rest. Its drawdown is measured at month-end, which flatters it: in the 2020 crash the rule held risk until the month closed, a -21.5% daily mark against -11.2% on the monthly figure. 2000 to 2009 was a wash against plain 10-month momentum. And the Red regime, the one the whole idea leans on, has fired in only 23 months of the record.
The useful conclusion
Top 2 is the variant we would point at, because it gives up only 0.03 of Sharpe for a shallower fall and nearly a third less turnover, and the 1.72 points of CAGR that Top 1 adds are the most fragile part of the record. Neither variant is a volatility trade, and anyone reaching for this expecting one has misread the rule.