Momentum is the idea that what went up over the past year tends to keep going up for a while. A member sent me a newsletter article built on the simplest version of it: each January, put everything into the single best-performing stock of the previous year. The figure in his message was 65.9% a year, unleveraged, and he said himself that it came from a strong bull market. A longer test in the same article adds a 35% stop loss: if the stock falls more than 35%, sell it and sit in cash until the next January.
He wanted to make it safer: 50% in last year's top 2 or 3 stocks with the same 35% stop, and the other 50% in something that doesn't go bust in a bear market, like a 4-year Treasury ladder. Each January the ladder refills the risky half, so one bad year can't end the strategy. He agreed I could write up what I found.
Why I didn't test single stocks
A fair test of "last year's best stock" needs every stock that traded in each year, including the ones that later went bust, were bought out or were dropped from the index. Our engine runs on funds and indices, and we don't have that history for single stocks.
The article doesn't say where its stock returns come from. If they're the yearly returns of today's S&P 500 members, which is what free return sites show, the test only sees companies that survived and are big today. A stock that doubled in 1999 and went to zero in 2001 isn't on that list, and it's exactly the kind of stock this rule would have bought.
The fund version
So I kept his structure and swapped the stocks for funds. Funds aren't free of the problem: I could only use funds that still exist. But a sector or country fund holds the whole group, so the companies that went bust are inside its return. The rules:
- On the first trading day of January, rank the funds in the group on last year's total return. Put 50% of the money, split equally, into the best 1, 2 or 3.
- If a fund closes 35% or more below its January price, sell it at the next close. That money waits in T-bills until January.
- The other 50% sits in Vanguard's short-term Treasury fund, which behaves much like a 4-year ladder and has daily prices. Before it opened in 1991, Vanguard's short-term federal bond fund stands in.
- Every January both halves go back to 50/50.
- 10 basis points per trade, the site's default cost, with dividends reinvested.
I ran it on 3 groups: the 9 US sector funds since 2000, 13 country funds since 1998 with the US as one of them, and 7 Fidelity sector funds back to 1988. 2 of the Fidelity funds are technology funds. Each result sits next to 2 plain versions with the same 50% in Treasuries: the other half in the S&P 500, or in every fund of the group equally.
Results with the top 2
| Group | Start | Top 2 + stop, % a year | Top 2 + stop, worst fall % | S&P 500, % a year | S&P 500, worst fall % | All funds equal, % a year | All funds equal, worst fall % |
|---|---|---|---|---|---|---|---|
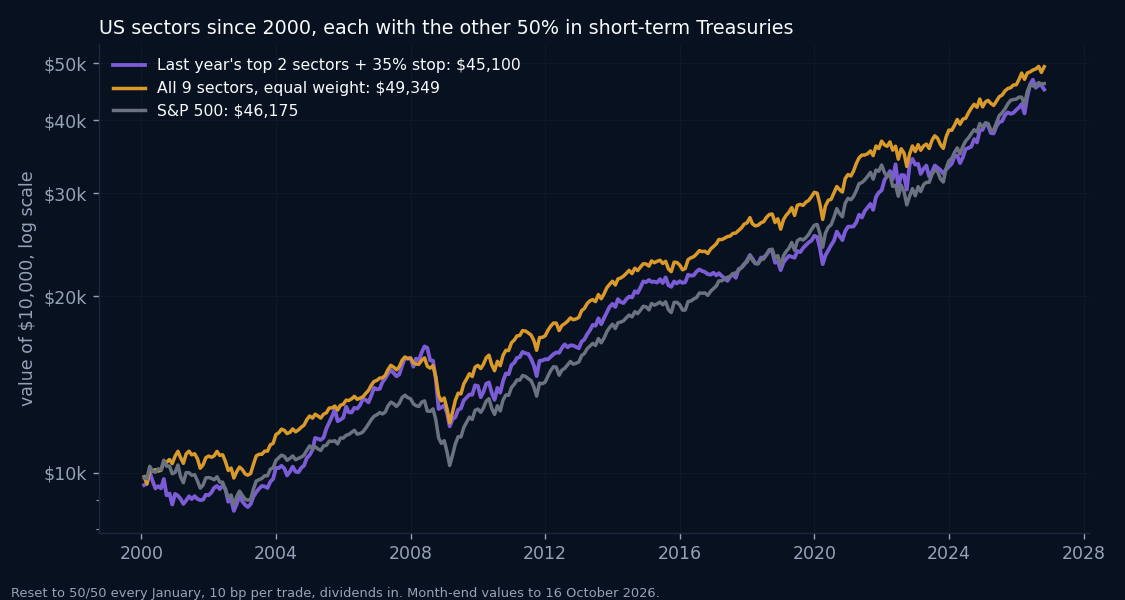
| US sectors | 2000 | 5.8% | -30.2% | 5.9% | -26.9% | 6.1% | -26.1% |
| Countries | 1998 | 4.0% | -30.4% | 6.4% | -26.9% | 5.9% | -30.5% |
| Fidelity sectors | 1988 | 10.8% | -34.7% | 7.7% | -26.9% | 9.0% | -26.3% |
| Fidelity sectors | 2000 | 7.3% | -34.7% | 5.9% | -26.9% | 7.2% | -26.3% |
Every column keeps 50% in short-term Treasuries and resets to 50/50 each January. Worst fall is the deepest drop from a peak. Prices run to 16 October 2026.
In US sectors and countries the momentum version earned the same as the plain versions or less, and fell further than the S&P 500 version. Picking 1 or 3 funds instead of 2 doesn't change that: 5.0% to 6.0% a year for US sectors, 3.1% to 4.3% for countries.
The Fidelity group is the one that looks good, 10.8% a year against 9.0% for holding all 7 equally. Most of that lead is from the 1990s. From 1988 to 1999 the top 2 earned 18.9% a year against 13.2% for the whole group. In 8 of those 12 years, one of the 2 picks was a tech fund. From 2000 on it's 7.3% against 7.2%, with a deeper worst fall, -34.7% against -26.3%.
Last year's winner mostly didn't stay ahead
The rule only works if a fund that led one year tends to lead the next. Over a 1-year hold, it didn't. The best US sector fund beat the sector average the following year 10 times in 26, and the best country fund 9 times in 28. In the Fidelity group it was 20 times in 38 since 1988, and 12 times in 26 since 2000.
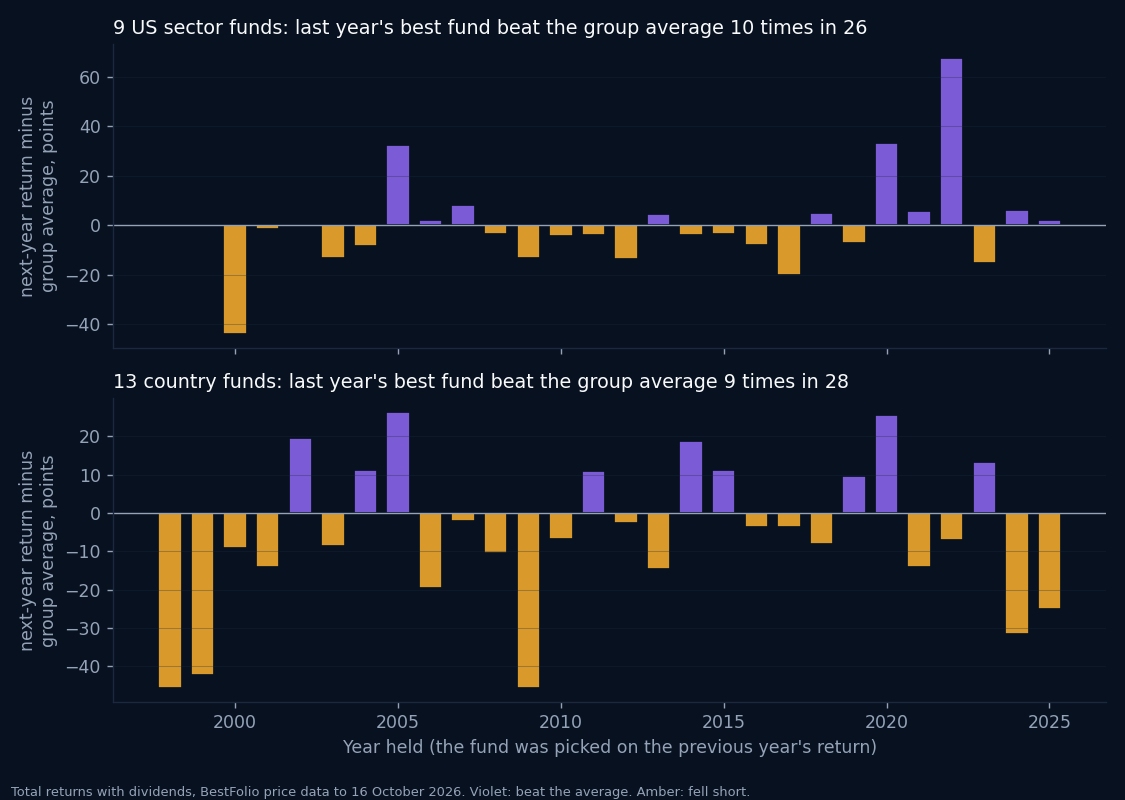
The misses can be big. Technology won 1999 and then lost 41.9% in 2000, while the average sector made 2.2%. The wins can be big too: energy, the 2021 winner, rose 64.2% in 2022 while the average sector lost 3.3%. Averaged over all the years, the sector winner did exactly as well as its group the next year, 0.0 points of difference. The country winner did 6.0 points a year worse.
The stop fired rarely, and often near the low
A fund seldom falls 35% below its January price within one year. So the stop fired only 2 to 8 times in 26 to 38 years, depending on the group and how many funds were held. When it did fire it was mostly in a sharp sell-off, late 2008 and March 2020 above all, and the money then sat in T-bills until January. Across the 1, 2 and 3-fund versions in the 3 groups there were 20 stop sales, and in 12 of them the fund was higher on 31 December than on the day it was sold.
| Fund sold by the stop (6 of the 20 sales) | Sold on | Fund's change from the sale to 31 December, % |
|---|---|---|
| US energy sector | 10 October 2008 | +13.0% |
| US materials sector | 10 October 2008 | -14.9% |
| Brazil | 30 September 2008 | -35.0% |
| Spain | 10 March 2009 | +92.0% |
| US financials sector | 17 March 2020 | +44.3% |
| Fidelity Select Semiconductors | 19 March 2020 | +109.9% |
Some of those sales saved real money, as with Brazil in 2008. More of them sold shortly before a rebound. In 2008 the stop cut the top 2 country version's loss from -20.7% to -12.9%. With only the top sector fund it made the same year worse, -20.1% against -16.6% without a stop, because it sold energy on 10 October and energy bounced. Across the groups, adding the stop to the top 2 version cost 0.2 to 0.5 points a year of return.
The yearly reset does the protecting
His first idea was slightly different from what I tested above: the ladder refills the risky half each January, but winners are never trimmed back into Treasuries. I ran that version too. It earns more, because after a few good years most of the money is in stocks, and that's also its problem.
| Group | Reset to 50/50, % a year | Reset to 50/50, worst fall % | Refill only, % a year | Refill only, worst fall % | Refill only, highest risky share % |
|---|---|---|---|---|---|
| US sectors since 2000 | 5.8% | -30.2% | 7.2% | -38.8% | 90.6% |
| Countries since 1998 | 4.0% | -30.4% | 4.3% | -43.5% | 84.0% |
| Fidelity sectors since 1988 | 10.8% | -34.7% | 14.7% | -63.7% | 99.7% |
Top 2 funds with the 35% stop in every row. The last column is the largest share of the whole portfolio the fund half ever reached.
Without trimming, the fund half grew to between 84.0% and 99.7% of the portfolio, so when the bad year came the Treasury buffer was mostly gone. The Fidelity version's worst fall, 63.7%, ended in October 2002. Setting both halves back to 50/50 every January is what keeps the buffer there.
What I take from it
With funds, I don't see the momentum part adding anything over holding the whole group. The Treasury half and the yearly reset do their job: the top 2 versions kept their worst fall between 30.2% and 34.7%, while the S&P 500 on its own fell 55.2% over the same years.
Single stocks might behave differently. They move far more than funds, and the article's numbers are far beyond anything a fund group produced here. But I can't check that without a survivor-free stock history, and a test that only sees today's survivors tends to find that buying winners worked.
If you want momentum with a way out of the market, most rules on our strategies page rank across asset classes and can move to bonds or cash. Our comparison of GTAA and sector rotation looks at a sector ranker that has a trend filter as its exit.
Thanks to the member who sent the idea and let me publish the test. I build BestFolio, and this test ran on its price data. Backtests are hypothetical and include no taxes. Past returns do not predict future ones.