This week a post on r/LETFs argued that leverage has stopped working in the US: borrowing costs are high, growth is slowing, and AI-driven trading makes markets jumpier. The top reply put numbers on it. Leverage costs 5% to 8% a year, and stocks have historically returned about 8%.
It sounds like simple arithmetic. So does a 5% to 8% bill really sink a 3x fund? I checked it against 49 calendar years of a 3x S&P 500 fund and 40 years of a 3x Nasdaq-100 fund, each set against the overnight rate it paid that year.
I was half expecting a clear downward slope. There isn't one. In years when the fed funds rate was high, 3x funds did about as well as in years when it was near zero. The rate sets a bar the stock market has to clear, and the market cleared it about as often when rates were high.
What a 3x fund actually pays
A 3x fund like UPRO holds about $3 of S&P 500 exposure for each $1 you put in. It borrows the other $2, mostly through swaps, at roughly the overnight rate plus a spread. With BestFolio's financing model (fed funds plus 0.5%), today's 3.88% fed funds rate costs about 8.8% a year on top of the 0.91% fee.
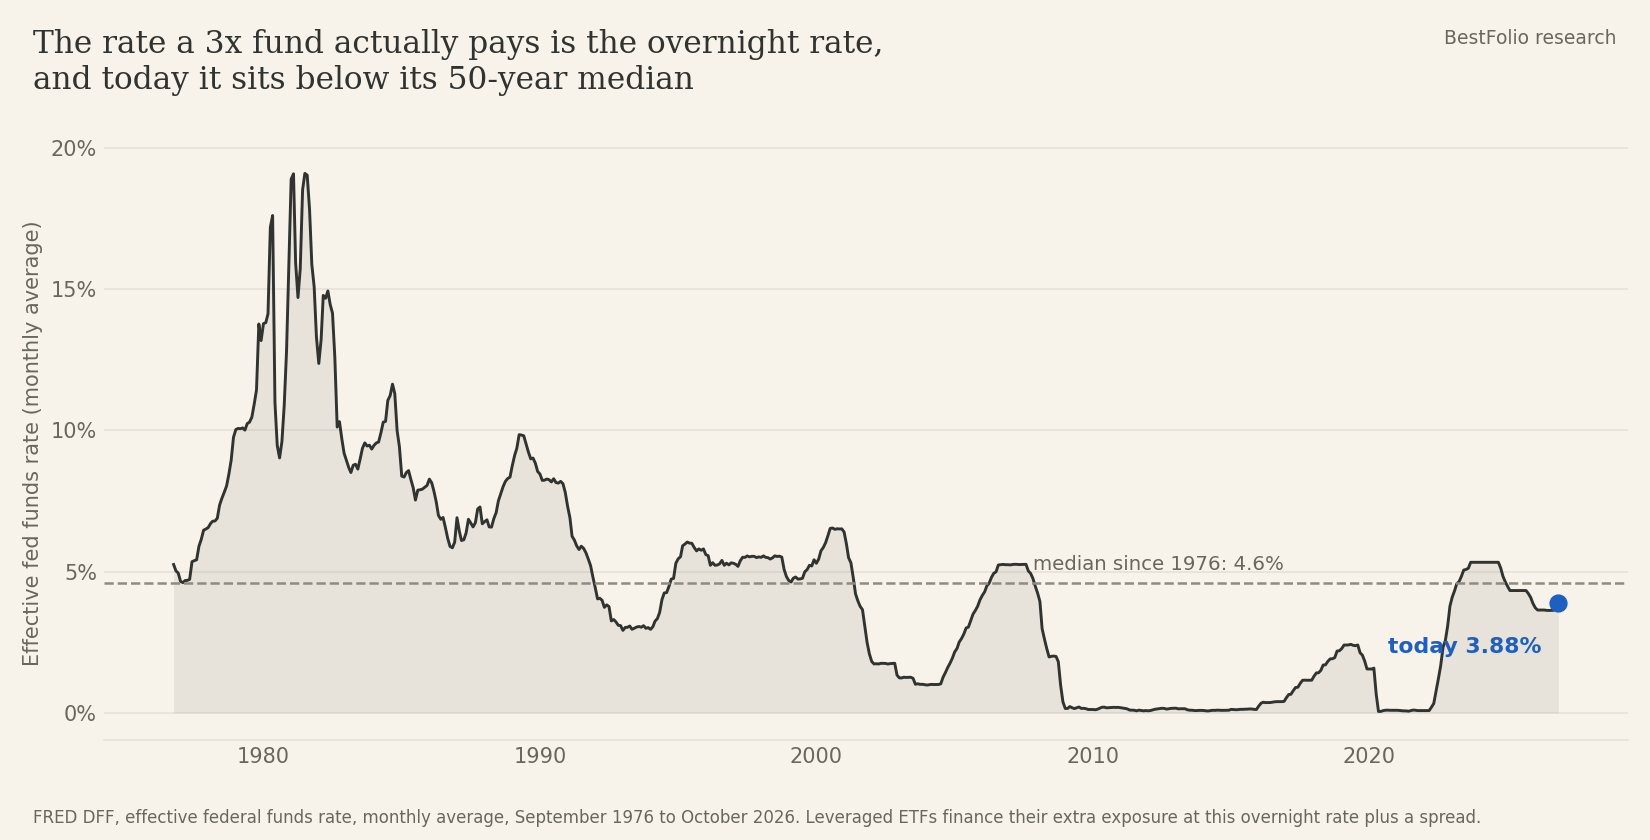
That's a real bill. The rate behind it is the overnight rate, though, and today it sits below its 50-year median of 4.6%. The rate that looks high is the 10-year Treasury yield at 5.22%, and a 3x fund doesn't borrow at that one.
How I tested it
Both series come from BestFolio's backtest engine. 3x S&P 500 is real UPRO since June 2009 and synthetic before that, back to September 1976: 3 times the S&P 500's daily total return, minus 2 times (fed funds + 0.5%), minus 0.91% in fees. 3x Nasdaq-100 is real TQQQ since February 2010 and synthetic back to October 1985. Where both exist, the synthetic series stay within 0.75% annually of the real funds.
I stopped where daily index data stops. Before 1976 (S&P 500) and 1985 (Nasdaq-100) the history is monthly, which hides most of the daily swings a 3x fund lives with and would flatter it.
For each full calendar year I compared the fund's return with the average fed funds rate that year.
Almost no relationship
Across 49 years of 3x S&P 500, the rank correlation between the year's rate and the year's return is -0.06. Its 95% range runs from -0.26 to +0.20, so the true link could be slightly negative, slightly positive or zero. 3x Nasdaq-100 gives -0.10 over 40 years (range -0.36 to +0.21).
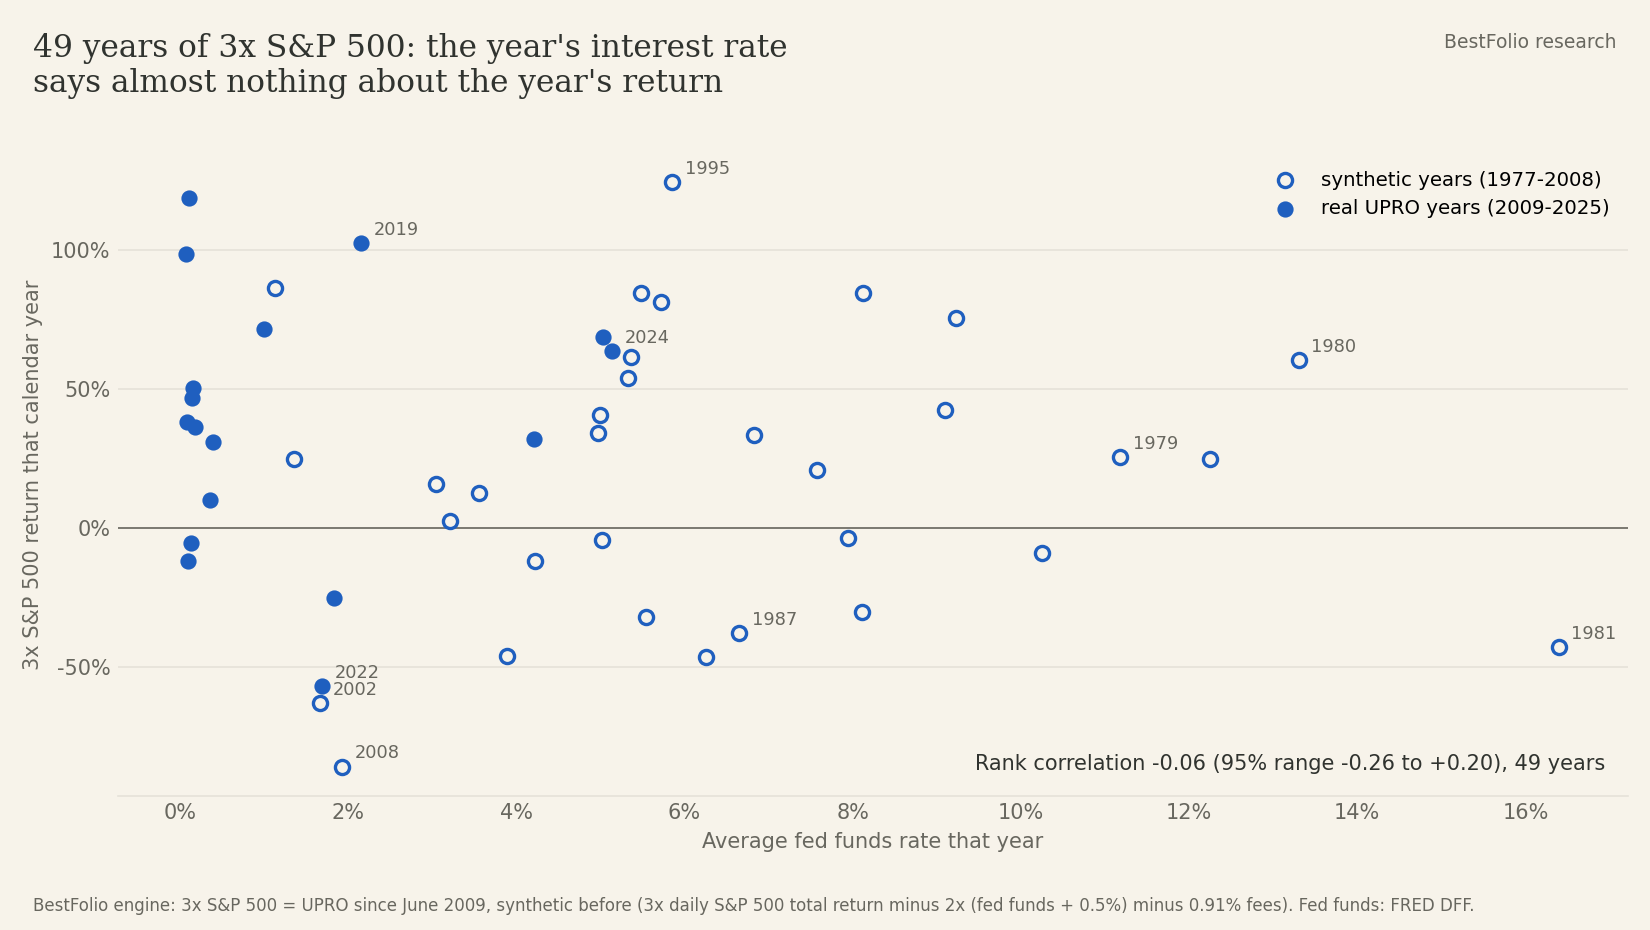
Real years and synthetic years say the same thing. With real UPRO (2009 to 2025) the correlation is -0.02. The 3 worst years for 3x S&P 500, 2008 (-86%), 2002 (-63%) and 2022 (-57%), all came with fed funds below 2%. 1980, with fed funds above 13%, returned +60%. The worst high-rate year was 1981: fed funds at 16% and a 43% loss.
Sorted by rate level
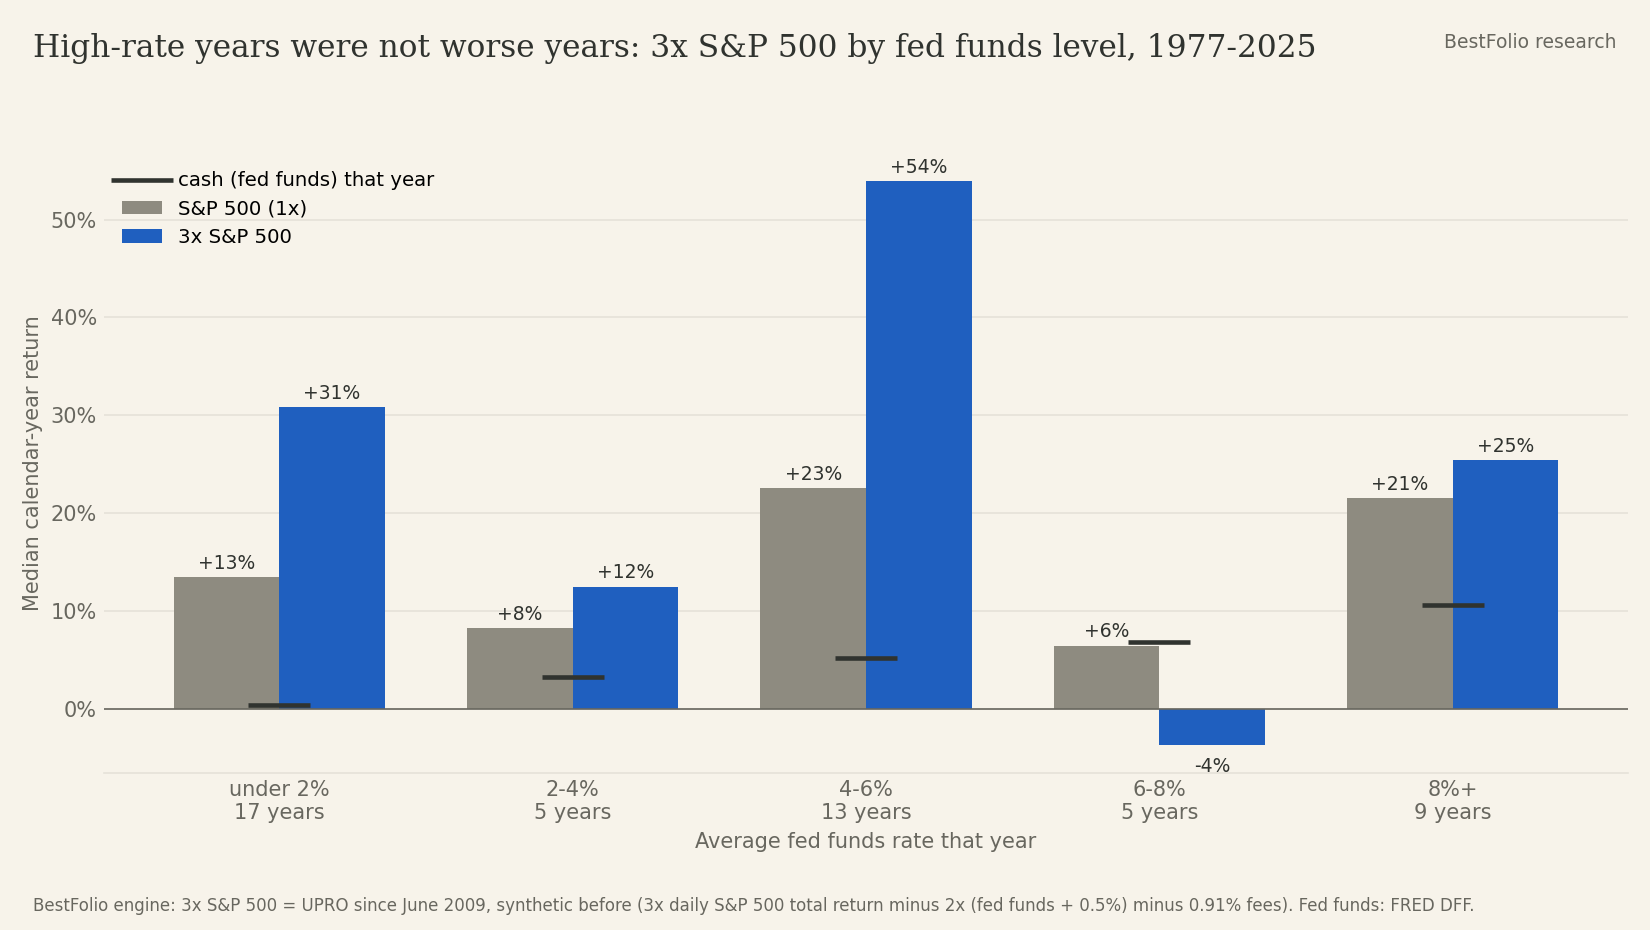
Grouped by the year's average rate, the best years for 3x came at 4% to 6% (median +54%, 13 years). The 9 years above 8% had a median of +25%. The weak group is 6% to 8%: 5 years with a median of -4%, and 2 of them are 1987 and 2000, a crash and the top of the dot-com bubble.
Counted another way, 3x S&P 500 beat the plain index in 8 of the 14 years with fed funds at 6% or more, and in 10 of the 17 years below 2%. That's about the same share.
Why the rate mostly cancels out
Rates are high for a reason. They tend to be high when inflation and nominal growth are high, and in those years stocks returned more in dollar terms as well. In the 9 years with fed funds above 8%, the S&P 500's median return was +21.5%, and it beat cash by a median 8.8 points.
A 3x fund's return is roughly cash, plus 3 times the market's lead over cash, minus fees, the financing spread and volatility drag. Write it down and the rate level mostly drops out. What's left is how far stocks beat cash, and how bumpy the ride was.
That gives a rule of thumb. At typical S&P 500 volatility (16% a year), 3x beats the plain index when stocks beat cash by more than about 5 percentage points over the year. Using each year's own volatility, that one line picked the winner in 48 of the 49 S&P years and in all 40 Nasdaq-100 years. In the 31 S&P years where stocks beat cash by more than 5 points, 3x came out ahead in 30.
Rates do hurt while they're climbing
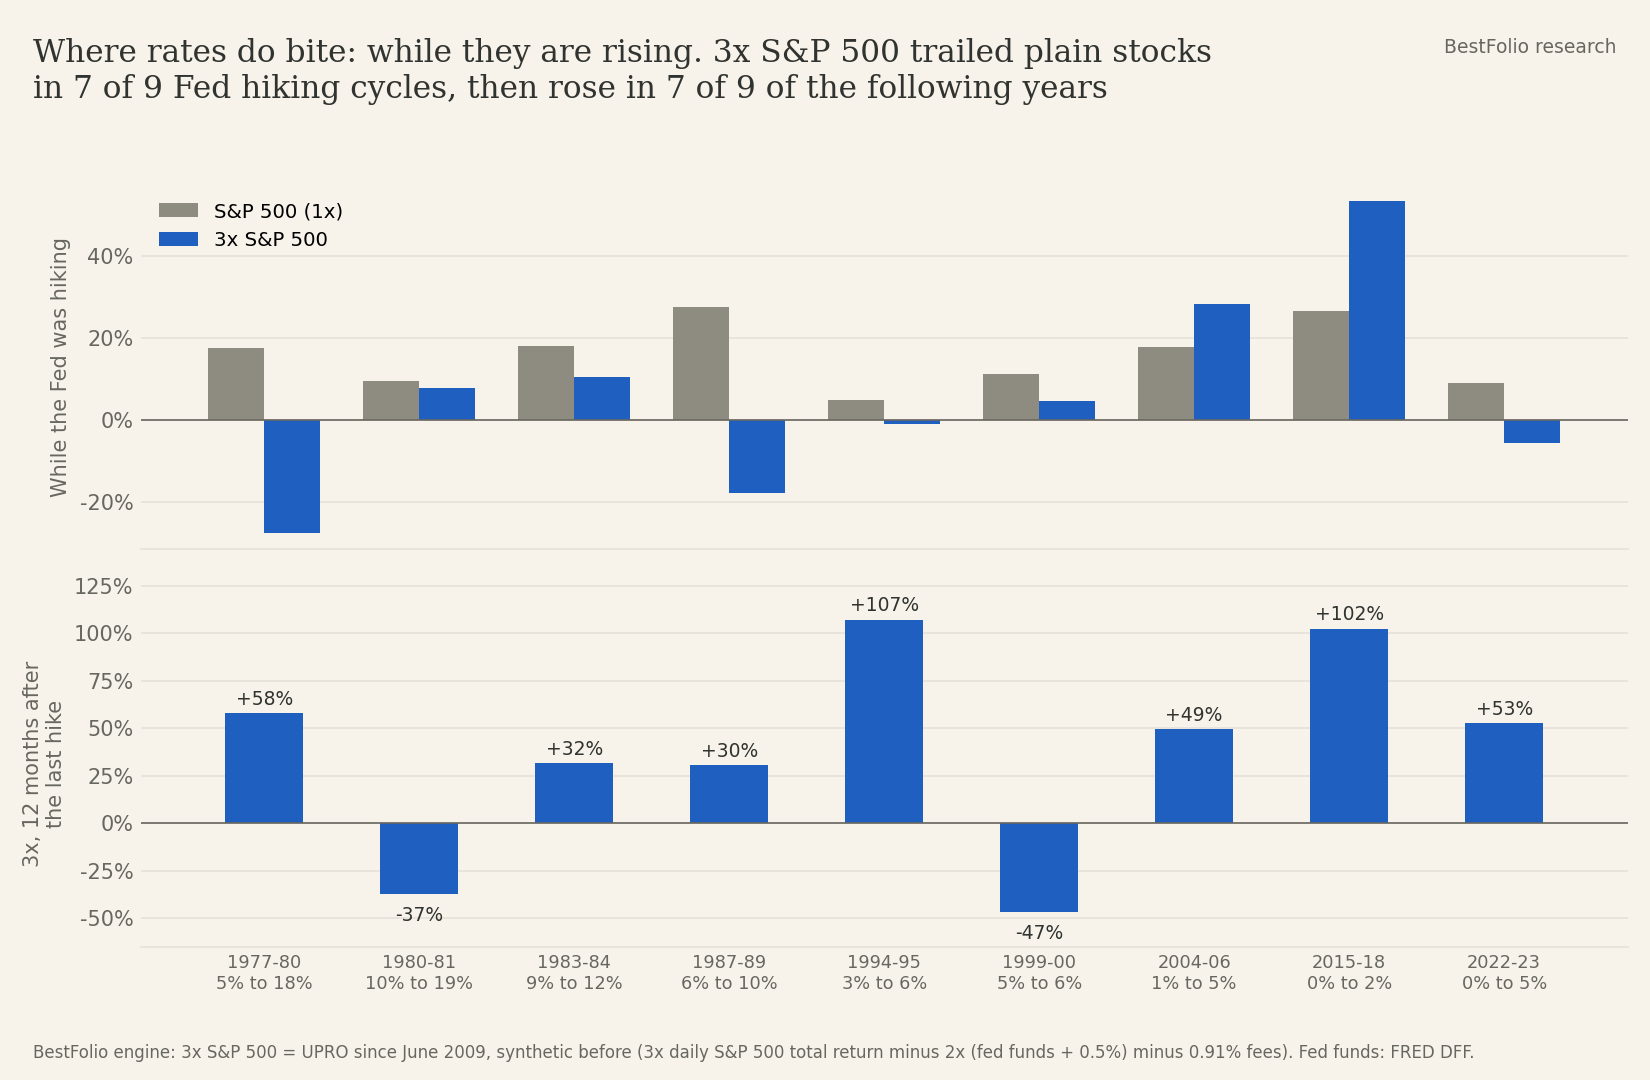
Rising rates are a different story, and it isn't a pretty one. In 9 Fed hiking cycles since 1977, 3x S&P 500 trailed the plain index in 7. In 1977 to 1980, with fed funds going from 5% to 18%, the S&P 500 made 17% and 3x lost 27%. In 2022 to 2023 it was +9% against -6%. Hiking cycles tend to come with jumpier markets, and the fund's financing bill climbs while they run.
In the 12 months after the last hike, 3x rose in 7 of 9 cycles, with a median of +49%. That's 9 episodes, so I'd hold the exact figures loosely... Fed funds has moved up from 3.63% in August to 3.88% this month, so this is the part worth keeping an eye on.
What actually breaks a 3x fund
Volatility and long bear markets. In my data, the correlation between a year's S&P 500 volatility and its 3x return is -0.35 over 49 years, and -0.69 in the real UPRO years, far stronger than anything the rate shows.
Held with no rule at all, 3x S&P 500 fell 98.3% from March 2000 to March 2009 (synthetic years), and real UPRO has fallen 76.8% from a peak. Since September 1976 it compounded 13.2% a year against 11.8% for the S&P 500, with a worst fall of -98.3% against -55.2%. That gap is why most leveraged strategies pair the fund with a trend rule or with assets that hold up in a crash.
On the volatility point from the original post: the S&P 500's realized volatility over the last 3 months is 10.9%, calmer than 74% of all 3-month stretches since 1976.
Limits
- Before June 2009 (S&P) and February 2010 (Nasdaq-100) the 3x series are synthetic. They assume financing at fed funds plus 0.5%; a fund paying a wider swap spread would do worse, at every rate level.
- 49 and 40 calendar years are not many data points, and the hiking-cycle comparison rests on 9 episodes.
- No taxes, no trading costs beyond the fund's own fees.
- History is not a forecast. If stocks beat cash by less than about 5 percentage points annually over the next decade, 3x will trail the plain index, whatever the rate does.
Bottom line
A 3x fund needs the stock market to beat cash by a decent margin, without too rough a ride. That's it. Over the last 49 years the level of interest rates didn't decide that. The stretches when rates were climbing were the hard part, and the deep bear markets were the dangerous one.
BestFolio publishes leveraged strategies with their full rules and backtests, drawdowns included, on the strategies page.