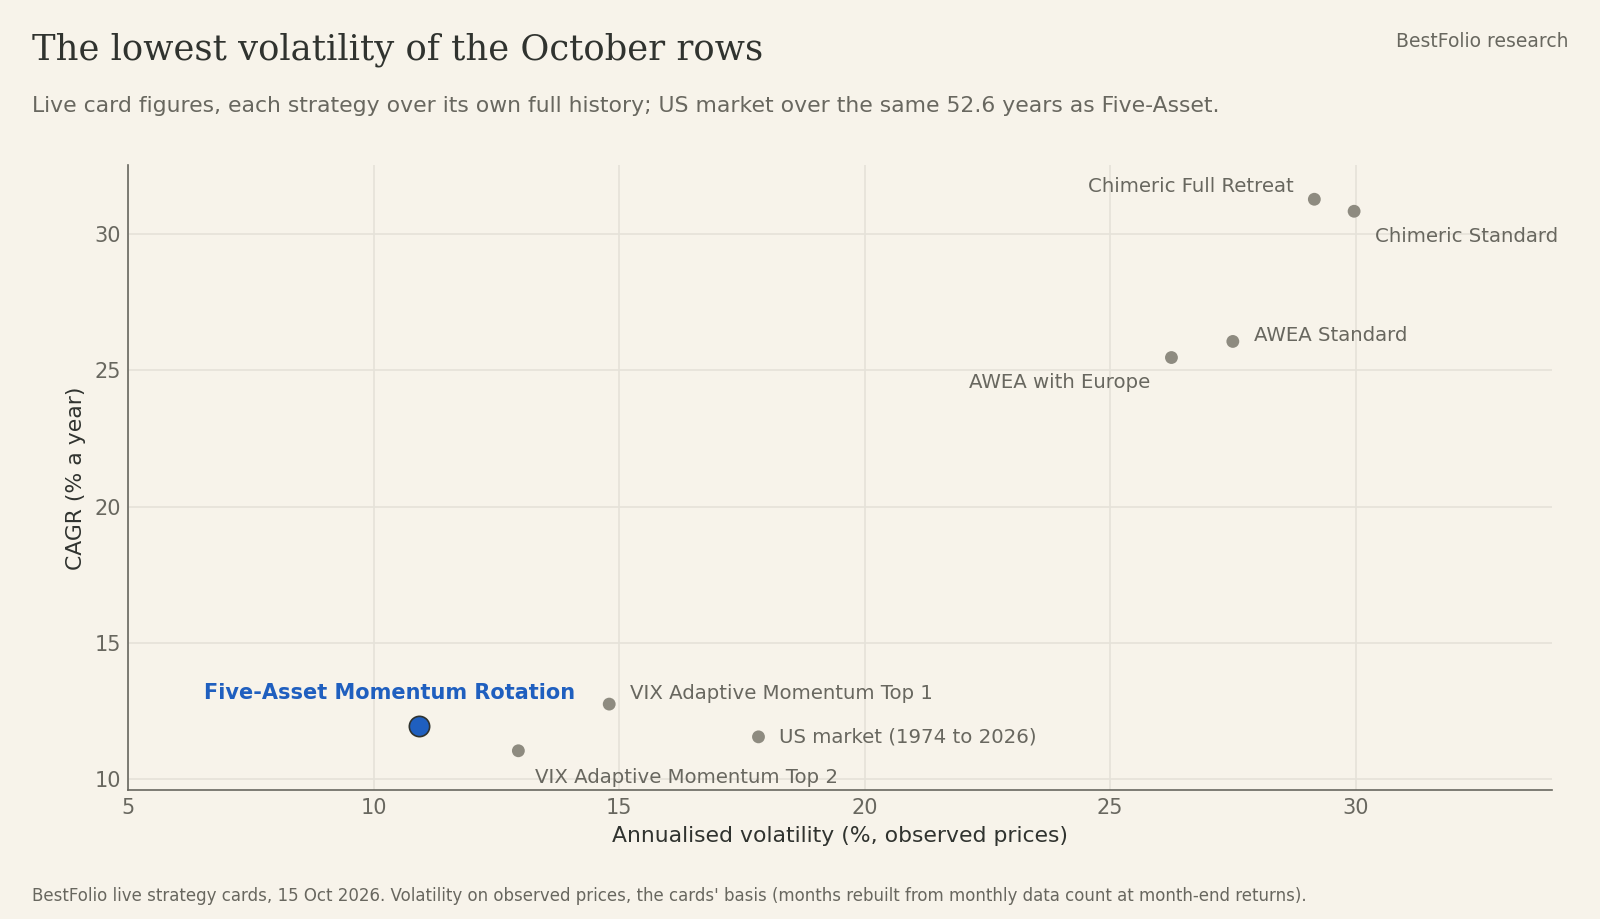
Five-Asset Momentum Rotation is one of the two quietest rows in the October batch (only FAA, at 9.6% volatility, is calmer) and probably the most broadly useful one. It is an unlevered monthly rotation across 5 assets, and its card covers 52.6 years. Here is what it shows now that it is live.
What the rule does
The rule was published by the Paper to Profit newsletter (Stuart, 2026) on the momentum framework of Macijauskas and Maditinos (2014). Each month it scores 5 funds (US stocks VTI, bonds AGG, REITs VNQ, commodities DBC and gold GLD) on the average of their 1, 3, 6, 9 and 12-month returns, and holds the top 3 in equal weight. There is no leverage, no volatility target and no separate canary: the rotation itself is the defence, because a deteriorating asset simply stops ranking.
The rule is short, but short is not the same as unfitted, and the strategy's own page says so. The published basket came out of a large combination search, and the gold slot is the mined ingredient: swap GLD for a foreign-equity fund and the ETF-era Sharpe drops from 0.95 to 0.77, with the worst fall deepening to -40%. Nearby versions (top 2, top 4, single lookbacks) land between 0.78 and 0.97, so expect live results nearer that family than the picked spec.
Same 52.6 years, side by side
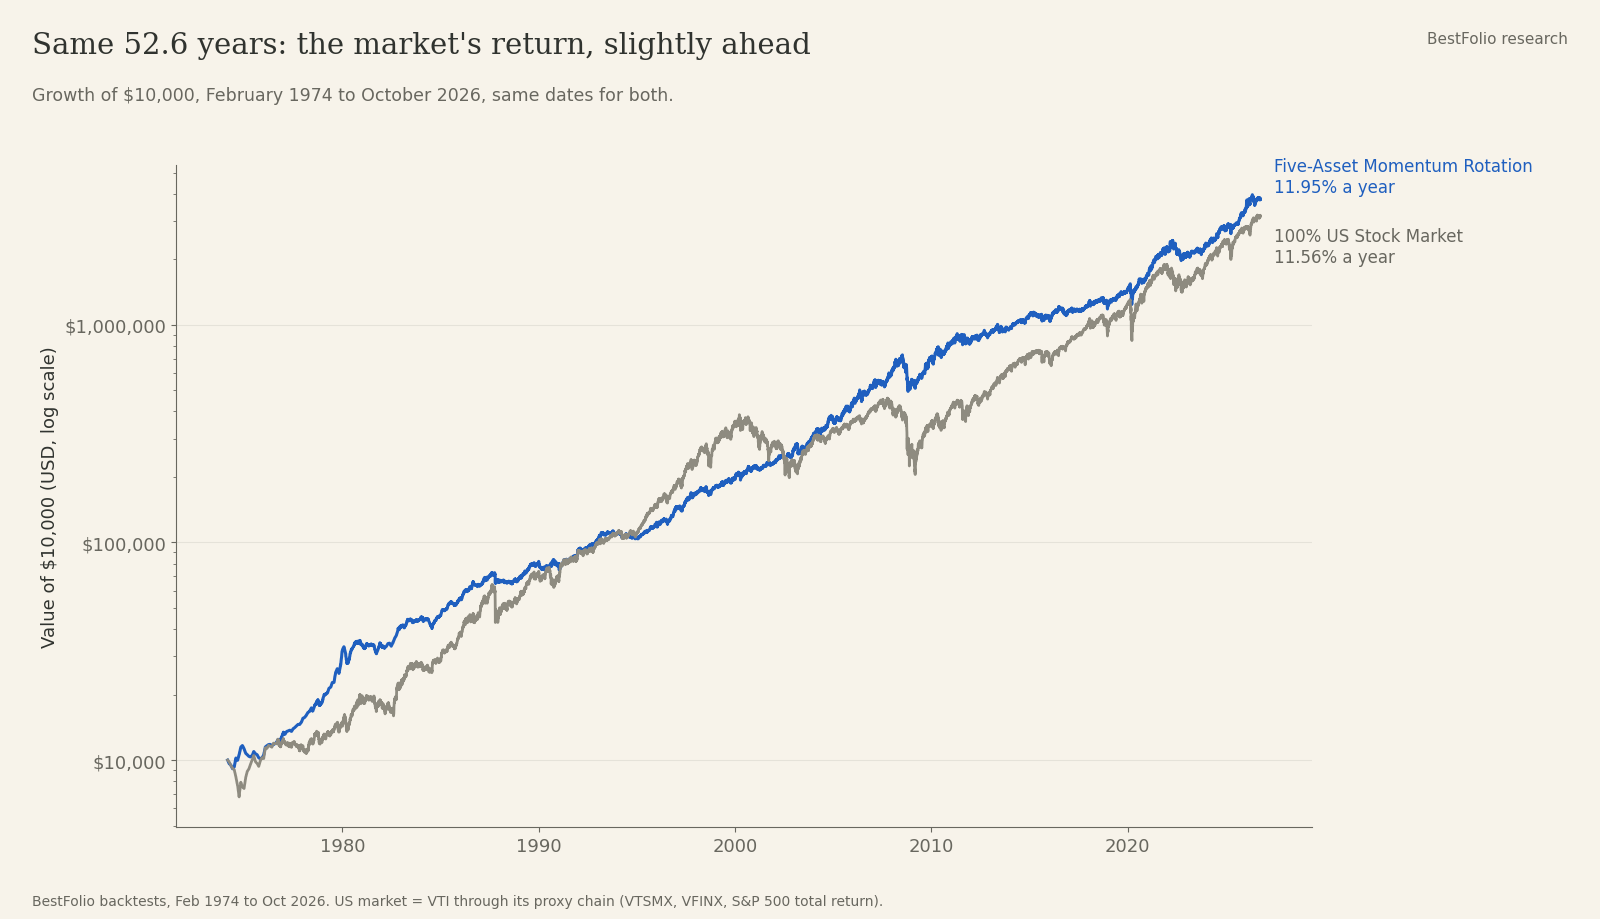
Both columns below run on the same dates, 28 Feb 1974 to 8 Oct 2026 (632 months), through BestFolio's own metrics code. The US market series is VTI from 2001, chained back through VTSMX (1992), VFINX (1987) and S&P 500 total return before that, so the benchmark's early years are reconstructed too. That's also why a few figures differ from the live cards.
| Metric (28 Feb 1974 to 8 Oct 2026) | Five-Asset Momentum Rotation | 100% US Stock Market |
|---|---|---|
| CAGR (% a year) | 11.95% | 11.56% |
| Sharpe ratio (no unit) | 1.14 | 0.78 |
| Sortino ratio (no unit) | 2.04 | 1.23 |
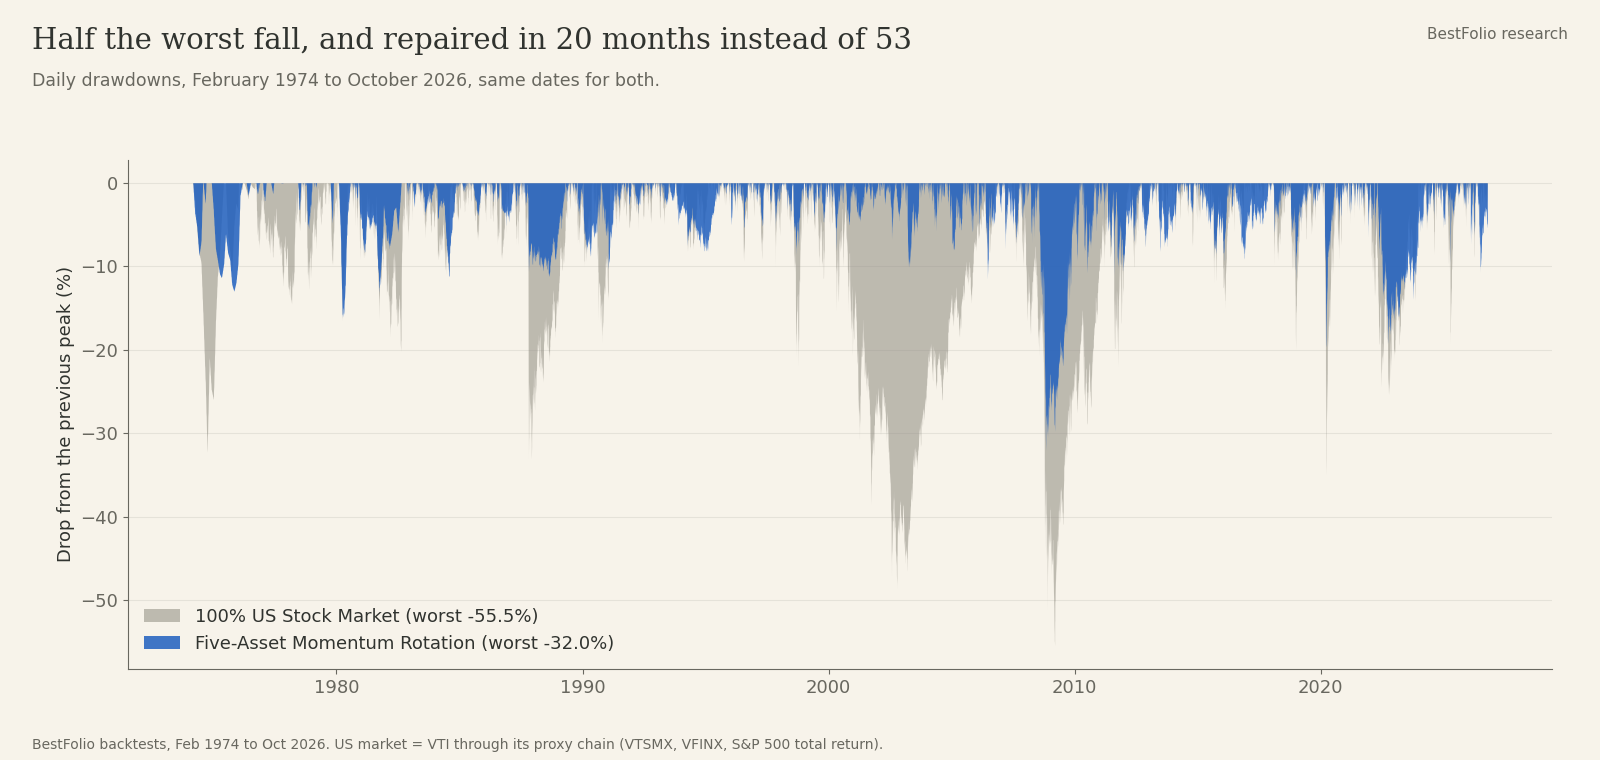
| Max drawdown, daily (%) | -32.0% | -55.5% |
| Max drawdown, month-end (%) | -26.0% | -50.8% |
| Month of the month-end max drawdown (month and year) | Oct 2008 | Feb 2009 |
| Annualised volatility, observed prices (% a year) | 10.93% | 17.84% |
| Longest recovery from the max drawdown (months) | 20 | 53 |
| Annual turnover, from the live cards (x per year) | 1.50x | 0.01x |
| History compared (years) | 52.6 years | 52.6 years |
The trade this actually offers
Over the same window the return is roughly the US market's, slightly ahead at 11.95% against 11.56%, and the volatility is about two thirds of it on month-end returns, 10.45% against 15.55% (10.93% against 17.84% on observed prices, the way the cards now measure it). The worst daily fall is 32.0% against 55.5% (26.0% against 50.8% on month-end prices), and it took 20 months to repair rather than 53.
That combination, and not the CAGR, is the reason this row is in the batch. A strategy that matches the market's return while spending under 2 years in its worst hole is a different instrument from one that matches the market by tracking it. The Sharpe of 1.14 against 0.78 is the same fact stated as a ratio.
Turnover is 1.50x a year, the lowest of the 5 October additions. In a taxable account that gap against a 4.23x strategy compounds into a real difference that no backtest line will show you.
Where it is weakest
A 5-asset universe is a small universe. Concentration is the cost of the simplicity: when the leaders are correlated, the rotation has nowhere better to go, and a monthly rebalance cannot react to anything that happens inside the month.
The 52.6 year card also leans on reconstructed index history for its early decades, as every long card here does. Treat the pre-ETF portion as evidence about the rule, not as a record of achievable trades.
The useful conclusion
This is the October row most likely to survive contact with a real portfolio, because it asks the least of you: no leverage, modest turnover and a drawdown that has historically repaired inside 2 years. It will also underperform a rising equity market for long stretches (in 2013 it made 6.0% while VTI made 33.4%), and that 11.95% a year is the reward for sitting through exactly that.