Chimeric Asset Allocation is the second strategy u/Separate-Ad-9633 has contributed to the catalog, after TQQQ Quadrant Stack in the September batch, and AWEA, his third, lands in this same batch. He designed it, he published the rules, and he checked our rebuild against his own before we agreed to list it. This is what the card shows now that it is live.
What the rule does
The strategy scores 10 assets, 8 of them leveraged funds, on 9 momentum signals each. The part that is not standard momentum is the adjustment: each score is penalised by how correlated that asset already is to the rest of the book, so a second holding that moves with the first has to score materially better to earn its place. The top 4 are held at a quarter each, rebalanced monthly.
The defensive rule is the other departure. When the TIPS signal turns negative, the Standard variant retreats part of the way to Treasuries rather than all of it. Full Retreat does go all the way. That single difference is the only thing separating the 2 rows below.
The tradable universe is 10 offensive assets (UPRO, TQQQ, EURL, EDC, TNA, PDBC, ERX, UGL, EDV and TMF) plus 2 defensive ones (IEF and SGOV); TIP steers the defensive switch and is never held. Of the 12, 7 are 3x funds and UGL is 2x. This is a leveraged strategy and the numbers below should be read as such.
What the card says
| Metric | Standard | Full Retreat | 100% US Stock Market |
|---|---|---|---|
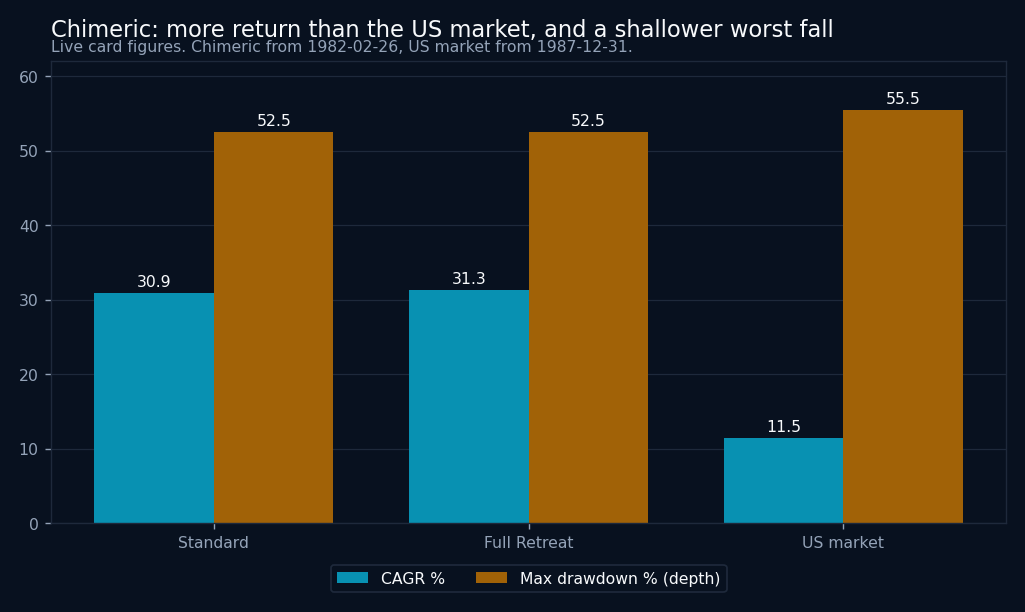
| CAGR | 30.82% | 31.25% | 11.40% |
| Sharpe | 1.06 | 1.11 | 0.80 |
| Sortino | 2.10 | 2.24 | 1.24 |
| Max drawdown | -52.48% | -52.48% | -55.45% |
| Annualised volatility | 28.37% | 27.52% | 17.81% |
| Months to recover that drawdown | 44 | 44 | 53 |
| Annual turnover | 3.51x | 3.67x | 0.01x |
| History on the card | 44.6 years | 44.6 years | 38.7 years |
Read the comparison carefully
Both variants returned more than 2.5 times the US market and had a shallower worst fall. That is a real result and it is also the kind of result that should make you suspicious, so here is what sits underneath it.
The windows are not the same. Chimeric's card starts in February 1982 and the benchmark row starts in December 1987, so the strategy includes a stretch the benchmark does not. The volatility is the honest summary of what you would actually hold: 28.37% against 17.81%. A shallower maximum drawdown does not mean a calmer ride, it means the worst single peak-to-trough episode was less deep.
Turnover is 3.51x a year for Standard and 3.67x for Full Retreat. On a book of 3x funds that is a meaningful cost and a meaningful tax event, and neither is a rounding error against a 30% headline.
What the replication actually established
The author sent his own full signal history. Our rebuild and his agreed on the held set in 126 of 136 months, which is 92.6%. Every one of the 10 divergences was a single asset rather than a wholesale difference, and 2 of those 10 were exact score ties, where the tie-break is a convention rather than a disagreement about the signal.
That is what we mean by replicated. It is not a claim that the strategy works. It is a claim that the rules are specified tightly enough for 2 independent implementations to land in the same place, which is the minimum bar before a strategy is worth publishing at all.
The useful conclusion
Over the full card, Full Retreat beats Standard on return, Sharpe (1.11 against 1.06) and Sortino (2.24 against 2.10) at the same maximum drawdown. It is not a clean sweep. Its stability score is lower, 0.44 against 0.52, and on the author's own window it loses: from 2007, Standard returns 24.9% a year against 22.7%. So the case for the cleaner rule rests on the reconstructed decades, and the case for his hedged rule rests on the years he designed it on. We publish both and would not crown either on this evidence.
The wider caution is unchanged: a 44.6 year card on a universe where most of the constituents did not exist for most of that period is a reconstruction, and the drawdown you should plan around is the 52.48% one that took 44 months to come back, not the CAGR.