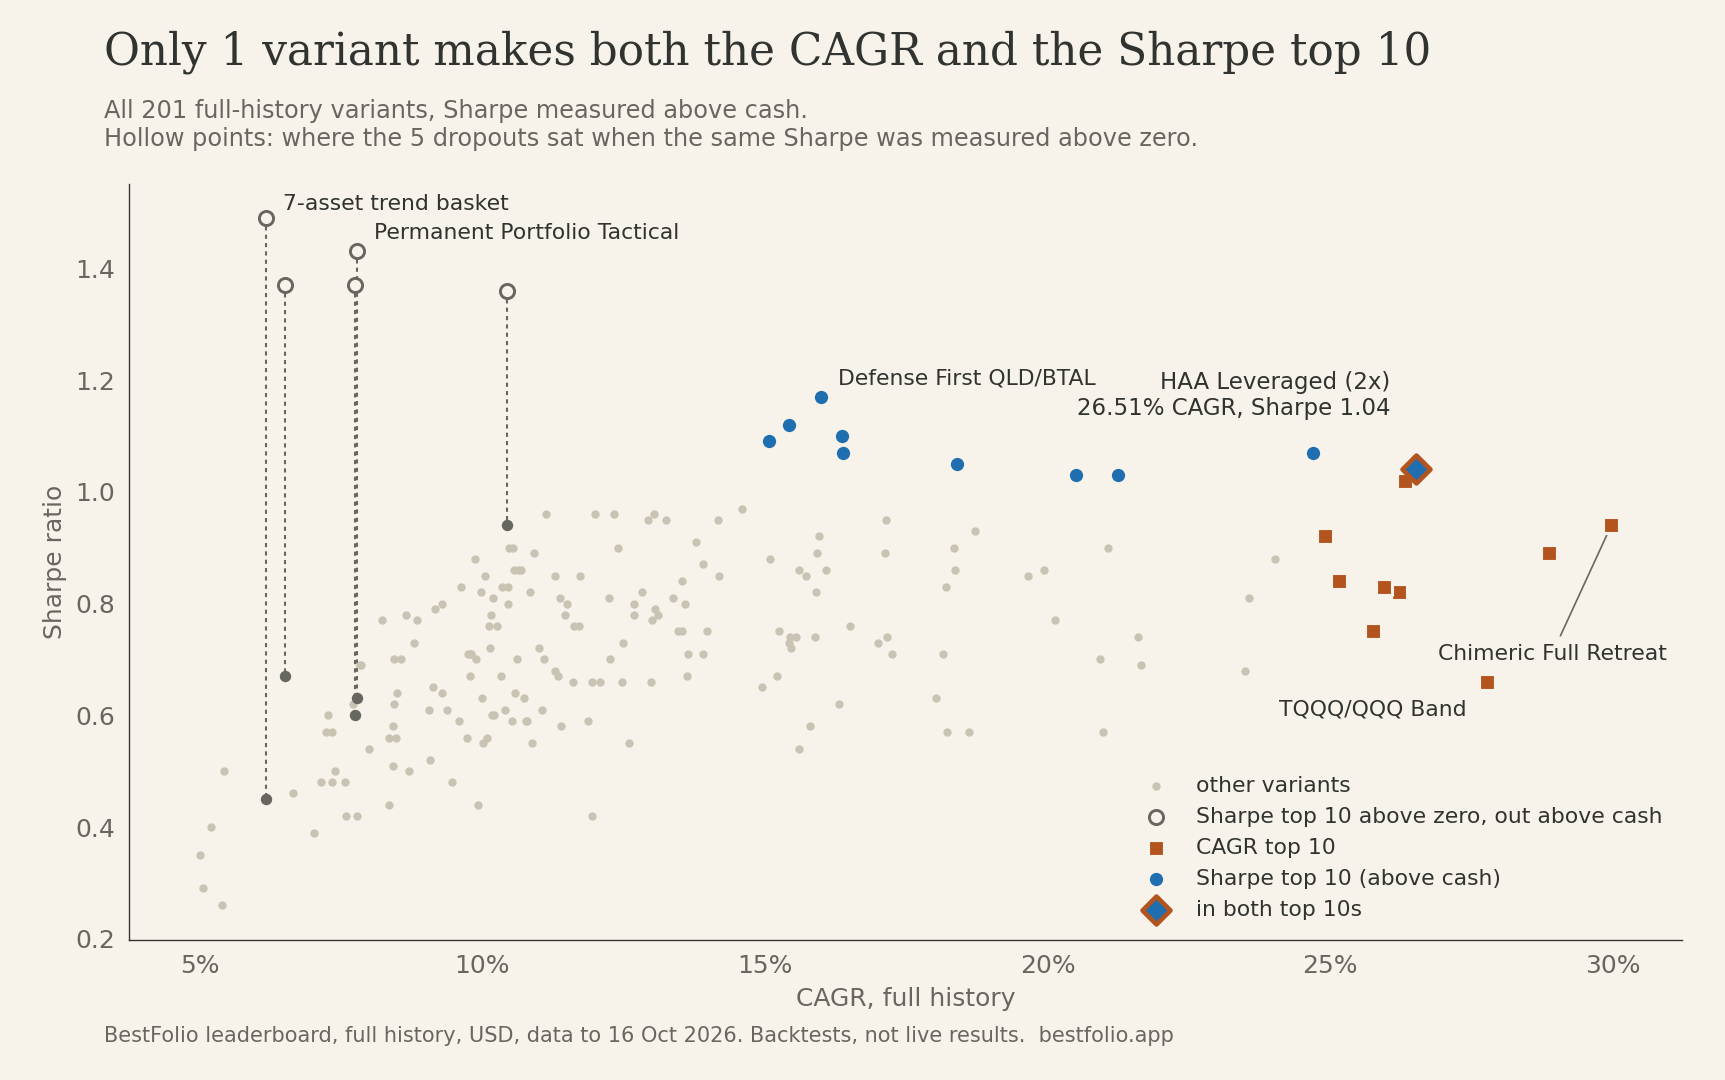
HAA Leveraged 2x is the only name in both the full-history CAGR top 10 and the Sharpe top 10 of our leaderboard. Measured above cash, Sharpe no longer puts low-return strategies at the top of its list.
A leaderboard sorted by return and the same leaderboard sorted by Sharpe answer different questions. CAGR asks how much a strategy compounded. Sharpe asks how much return it earned for each unit of volatility it put you through. If you pick strategies from a sorted table, the column you sort by matters as much as the strategy you click.
I sorted all 201 full-history variants on the BestFolio leaderboard both ways. 3 things came out of it:
- The 2 top-10 lists share 1 name, HAA Leveraged 2x. It compounded 26.51% a year from February 1974 with a -36.46% worst fall. Over that period the US stock market made 11.54% a year, with a -55.45% worst fall.
- The rank correlation between the CAGR sort and the Sharpe sort is 0.57. Measured above zero, on the same data, it was -0.07.
- Measuring Sharpe above cash moved 5 low-return variants out of the Sharpe top 10. Their CAGRs run from 6.18% to 10.44%.
Since 18 October, BestFolio measures Sharpe above cash: the T-bill return is subtracted before dividing by volatility (changelog, methodology note). Every number below uses the same stored backtests to 16 October 2026. Only the cash reference differs between the 2 Sharpe columns.
| Check | Sharpe above zero | Sharpe above cash |
|---|---|---|
| Rank correlation with the CAGR sort | -0.07 | 0.57 |
| Names shared with the CAGR top 10 | 0 | 1 |
| Leveraged variants in the Sharpe top 10 | 1 | 5 |
| Median CAGR of the Sharpe top 10 | 12.76% | 17.39% |
| Median worst fall of the Sharpe top 10 | -15.20% | -23.14% |
Who left the Sharpe top 10
The 5 that dropped out all have low volatility, from 3.52% to 7.92% a year. 4 of them beat T-bills by less than 3.5 points, and the same 4 hold cash by design. The Permanent Portfolio variants keep a quarter in cash and move a weak asset's share into cash too. The 2 Defensive Rotation sleeves switch to T-bills when their trend or momentum test fails. PAA Dynamic Protection parks its defensive share in short or intermediate Treasuries.
| Variant | From | CAGR | Cash over the same years | Volatility | Sharpe above zero | Sharpe above cash |
|---|---|---|---|---|---|---|
| 7-asset trend basket (Defensive Rotation) | 1974 | 6.18% | T-bills 4.36% | 3.52% | 1.49 (3rd) | 0.45 (191st) |
| Permanent Portfolio Tactical | 1960 | 7.79% | T-bills 4.39% | 5.29% | 1.43 (5th) | 0.63 (144th) |
| Tactical Permanent Standard | 1960 | 7.75% | T-bills 4.39% | 5.51% | 1.37 (8th) | 0.60 (155th) |
| IEF or bills 70%, gold 15%, managed futures 15% (Defensive Rotation) | 1921 | 6.52% | T-bills 3.36% | 4.09% | 1.37 (8th) | 0.67 (127th) |
| PAA Dynamic Protection | 1985 | 10.44% | T-bills 3.20% | 7.92% | 1.36 (10th) | 0.94 (21st) |
Take Permanent Portfolio Tactical. It compounded 7.79% a year from 1960 with a -14.91% worst fall, and T-bills compounded 4.39% in those years. Above zero, all 7.79% counted as reward for its 5.29% volatility, and it ranked 5th. Above cash, only the part above T-bills counts, and it ranks 144th. Nothing about the strategy changed. The ranking stopped paying it for the T-bill interest anyone could have had.
I'd still hold a sleeve like this for what it does in a crash. It just doesn't belong next to HAA on a return-per-risk list, and the old column suggested it did.
Why the quiet strategies fell the most
Subtracting cash takes roughly the same return away from every strategy that ran over the same years. Sharpe then divides by volatility. So a strategy with 3.52% volatility loses far more Sharpe than one with 21.11%, even though both gave up the same T-bill return.
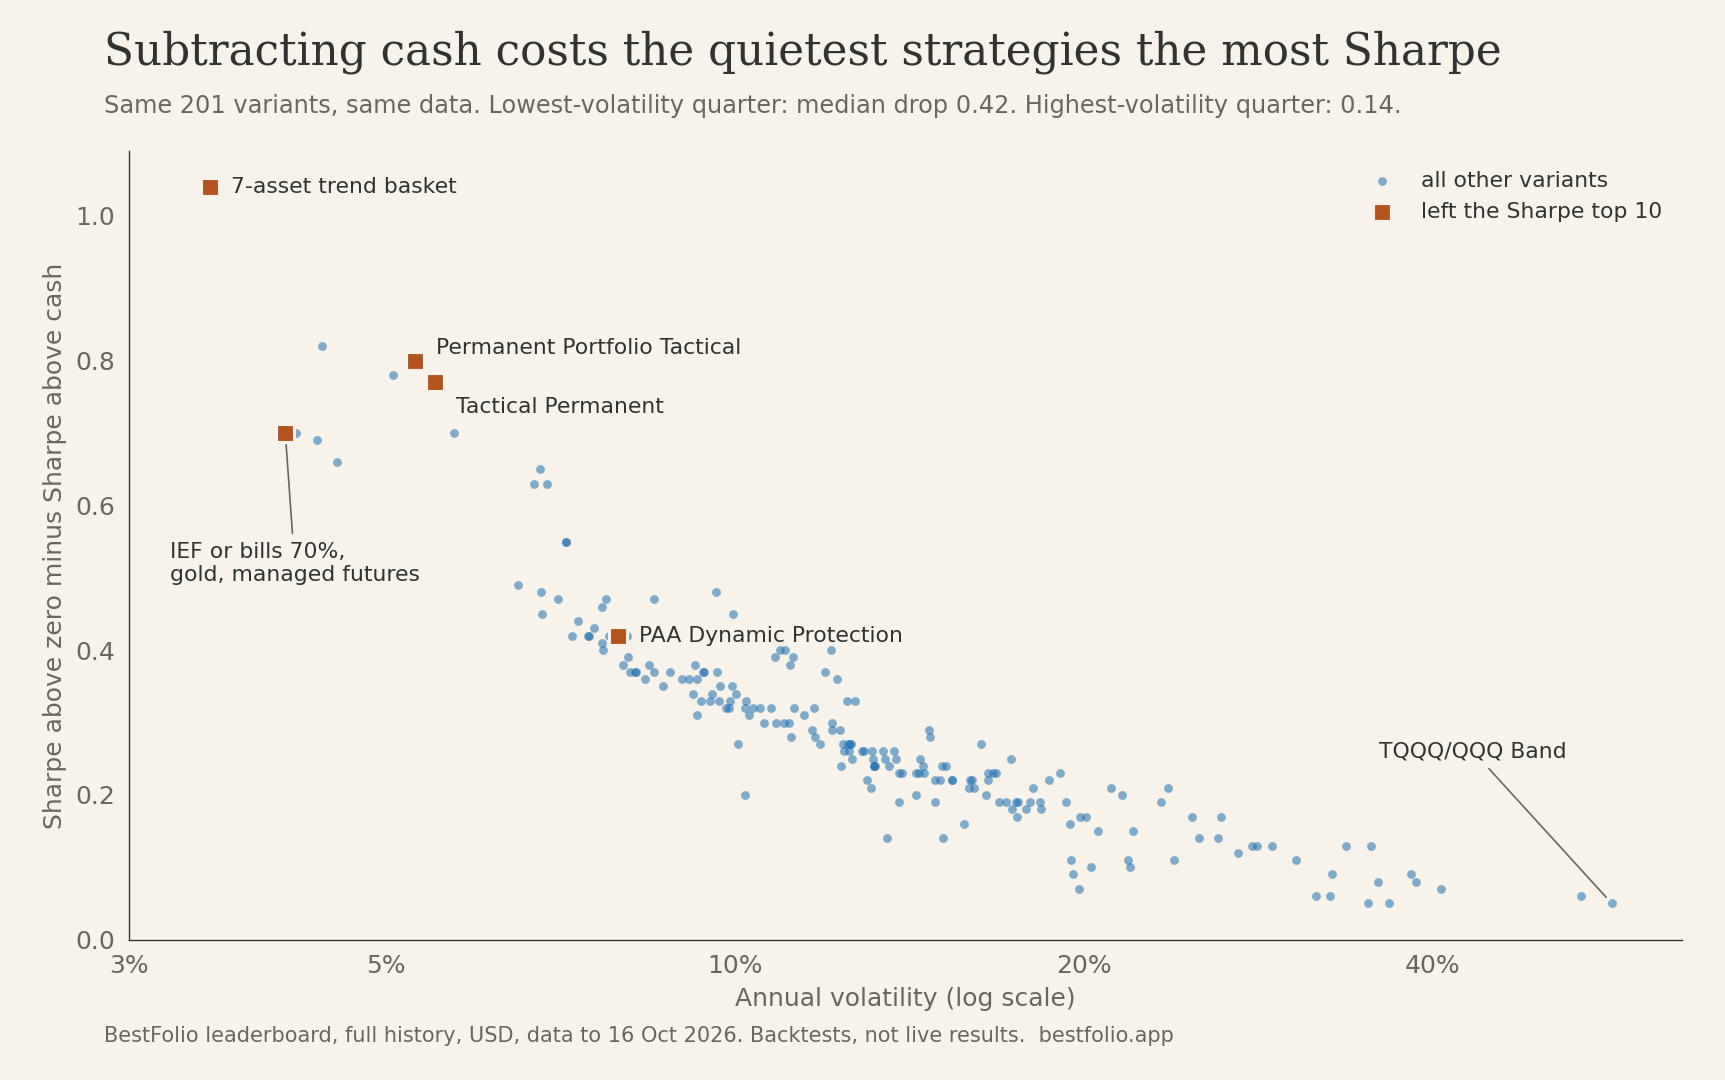
Across the 201 variants, the size of the drop tracks 1 divided by volatility with a correlation of 0.95. The median variant lost 0.27. Not one variant's Sharpe went up.
That last point matters for reading the new top 10. The 5 newcomers didn't climb. They fell less than the strategies around them.
| Variant | From | CAGR | Worst fall | Sharpe above zero | Sharpe above cash |
|---|---|---|---|---|---|
| Defense First QLD/BTAL Fallback | 2003 | 16.00% | -23.62% | 1.31 (13th) | 1.17 (1st) |
| HAA Leveraged without QQQ | 1974 | 24.70% | -27.97% | 1.30 (14th) | 1.07 (5th) |
| HAA Leveraged 2x | 1974 | 26.51% | -36.46% | 1.25 (27th) | 1.04 (8th) |
| HAA SmartLeverage 1.5x | 1974 | 21.25% | -27.90% | 1.30 (14th) | 1.03 (9th) |
| Golden Ratio Dual Gate | 2008 | 20.51% | -37.29% | 1.10 (74th) | 1.03 (9th) |
There is one catch I'd keep in mind. These are full-history numbers, so start dates differ. Defense First QLD/BTAL starts in 2003 and Golden Ratio Dual Gate in 2008, and T-bills paid 1.66% and 1.29% across their histories. A 1974 start pays 4.36%. A recent start costs less to clear, so the cash change helps the youngest strategies a little.
CAGR and Sharpe still disagree
A rank correlation of 0.57 means the 2 sorts now lean the same way. They still pick different leaders. All 10 names in the CAGR top 10 are leveraged, and their median worst fall is -53.07%. The Sharpe top 10 has a median worst fall of -23.14%.
| Variant | CAGR | Worst fall | Sharpe above cash |
|---|---|---|---|
| Chimeric Asset Allocation Full Retreat | 29.97% (1st) | -53.07% | 0.94 (21st) |
| Chimeric Asset Allocation Standard | 28.86% (2nd) | -53.07% | 0.89 (32nd) |
| TQQQ/QQQ Band | 27.78% (3rd) | -95.76% | 0.66 (133rd) |
TQQQ/QQQ Band is the clearest case. It is 3rd on return with a -95.76% worst fall, and its Sharpe barely moved with the cash change, from 0.71 to 0.66, because its 57.13% volatility dwarfs any T-bill rate. It ranks better than before only because quieter strategies fell past it.
Sharpe still has blind spots
Sharpe treats upside and downside moves the same, and it squeezes the order of returns into one standard deviation. A strategy with rare, large losses can look calmer than its left tail deserves until the loss arrives. Measuring above cash fixes one bias, the credit for holding T-bills. It doesn't fix those.
Pick the objective before the sort button
This is the order I'd use so that no single column makes the decision:
- Set the minimum return the plan needs, and compare it with what T-bills paid over the same years.
- Set the deepest fall you could sit through at the size you intend to hold.
- Use Sharpe above cash, or Sortino, to compare what's left.
- Check Calmar and recovery time, in case the result hangs on 1 historical loss.
- Repeat the ranks on a common window and after estimated trading costs.
One variant made both top 10s, and it took a -36.46% fall to get there. Measured above cash, the Sharpe top 10 is a list of strategies that earned real return with moderate falls, not a list of strategies that mostly earned the T-bill rate.
Data source
BestFolio full-period leaderboard, USD, 201 variants, data to 16 October 2026. Sharpe above cash is the live leaderboard value. Sharpe above zero is the value kept on the same stored backtest when the site switched on 18 October. US stock market and T-bill figures come from the same BestFolio data over each variant's own dates. These are full-history rankings, so start dates differ from one variant to the next.
Past performance does not guarantee future results. Backtested results are hypothetical and do not represent actual trading.